

How fast can one part program create $100,000 in annual value? Two seconds may be enough to start.
Return on investment matters everywhere in the plant. Engineers need to justify process changes. Plant managers need to protect throughput, quality, and margins. IT and data teams need to connect information to decisions. Training leaders need to show that stronger skills improve performance.
Different responsibilities. The same question: what will this improvement return?
RJG helps molders answer that question with real production data, practical expertise, and a clear path from opportunity to measurable results. Start with the RJG ROI Calculator.
What Could $100,000 Look Like?
The opportunity may be hiding in a few seconds of cycle time, higher uptime, lower scrap, better labor efficiency, or several realistic improvements working together.
For example, reducing a 20-second cycle to 18 seconds saves about 556 hours of press time across one million cycles. Add improvements in uptime and scrap, and the business impact can grow quickly.
The goal is not simply to make a cheaper part. It is to make a good part more efficiently, consistently, and profitably.
Run Your Real Process
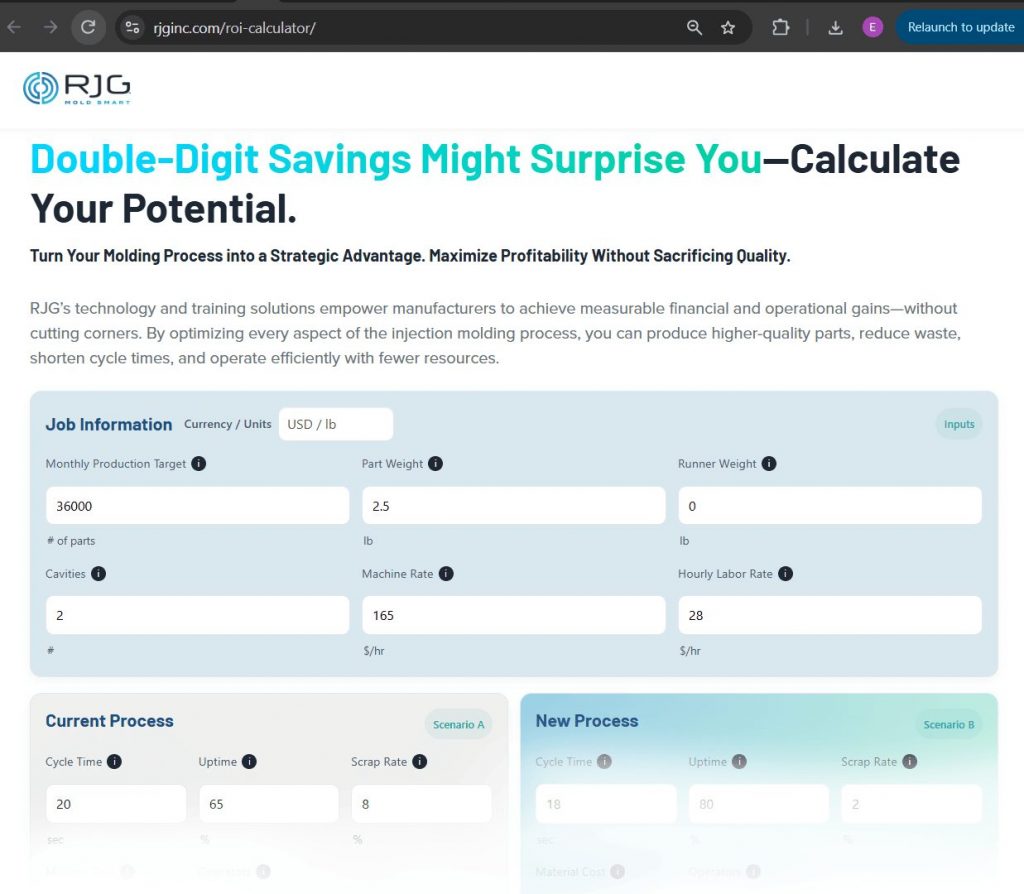
Choose one active part program and enter the numbers your team already knows:
- Production target and cycle time
- Part and runner weight and material cost
- Uptime and scrap rate
- Machine and labor rates and number of operators
Then change one variable at a time. What does a two-second cycle reduction return? What is the value of moving uptime from 65% to 75%? What happens if scrap falls from 8% to 4%?
Use achievable assumptions. The strongest business case is not the largest theoretical number. It is an improvement the processing team believes is technically sound, operations can sustain, data can verify, and leadership can justify.
One Process. Four Views of ROI.
- Process Engineering: More repeatable processes, faster troubleshooting, lower scrap, and shorter cycles.
- Plant and Operations Leadership: More capacity, stronger margins, reliable output, and less firefighting.
- IT and Data Teams: Production data connected to decisions, priorities, and plant-wide performance.
- Training Leaders: Skills development tied to measurable gains in quality, productivity, and consistency.
The calculator gives every group a shared language: time, cost, capacity, quality, and profit.
A Sample $189,232 Opportunity
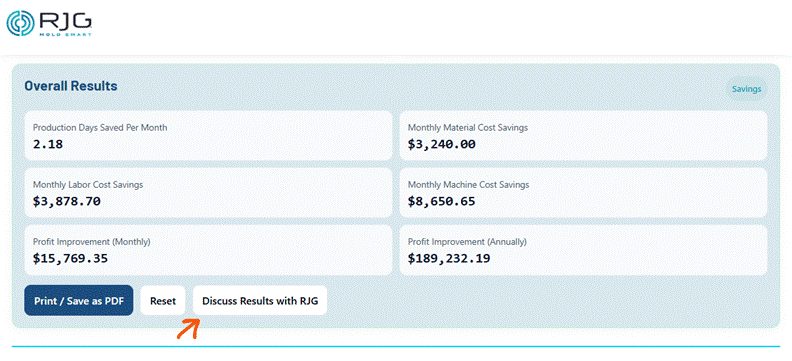
In the sample below, realistic changes to cycle time, uptime, and scrap produce an estimated $15,769.35 in monthly profit improvement, or $189,232.19 annually.
Calculate It. Then Build the Plan.
A calculator can identify where value may exist. It cannot determine whether every improvement is technically achievable for your mold, machine, material, part, and team.
That is where RJG can help. Share your results and talk through what it could take to capture the opportunity. Depending on what the numbers reveal, the path may include scientific molding training, consulting, process monitoring and control, or plant-wide data visibility.
The better question is not simply, “Should we invest?” It is: “If this opportunity is worth $100,000, what will it take to capture it and prove the return?”
Find Your ROI
Pick one part program. Run the numbers. Then use Discuss Results with RJG to explore what may be realistically achievable and how to move from an estimate to measurable savings.