

A useful molding data system should do more than collect numbers. It should help your team understand what happened, decide whether it matters, respond with evidence, and confirm that the response worked. When those steps are connected, data can shorten troubleshooting, strengthen process discipline, and make hard-won knowledge easier to use across shifts and facilities.
The challenge is rarely a complete lack of data. A press may display setpoints, actual values, cycle information, alarms, and trend charts. Quality may maintain inspection results. Technicians may keep setup sheets or change logs. Yet the information can remain scattered, difficult to compare, or detached from the event that created a questionable part. More data does not automatically create a better decision. Context does.
One practical way to evaluate your current approach is to ask whether it can answer five questions, from a single shot to the whole plant.
1. What happened during this shot?
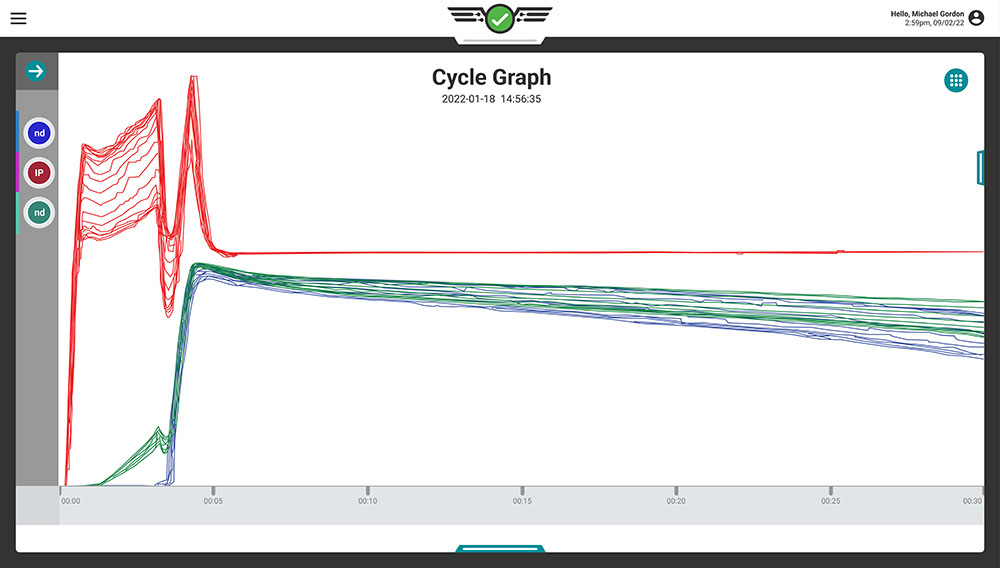
When a process changes, the first need is an objective record. Which values moved? When in the cycle did the change appear? Was it a single event, a gradual drift, or a repeated pattern? Machine settings alone describe what the press was instructed to do. Machine and mold signals can provide a more complete view of what the process actually experienced.
CoPilot® is designed to display data from each shot, monitor process behavior, identify changes, and support real-time notifications. Depending on the product configuration, application, and installed sensors, the team can examine available machine and mold data instead of relying only on a final inspection result or a recollection of what happened.
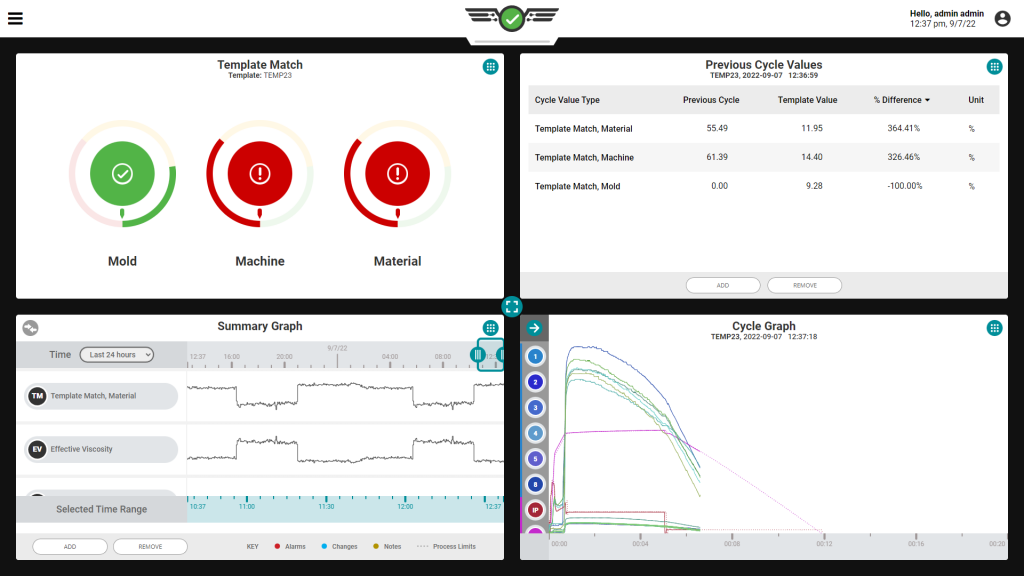
That visibility does not replace the processor. It gives the processor a stronger starting point. Instead of making several adjustments to see what helps, the team can compare the event with a known process and investigate the part of the cycle that actually changed.
2. Did the change matter to part quality?
Not every change is a defect, and not every stable machine value proves a good part. The useful question is whether a process signal has a demonstrated relationship to a critical part requirement. That relationship may be developed through process studies, part measurements, historical evidence, and appropriate statistical analysis.
This is why alarm limits should be based on the specific process and quality relationship, not on a convenient universal percentage. A sound monitoring strategy starts with an important part characteristic, identifies the process variables that influence it, and establishes limits using capable, approved production data. Monitoring and containment can reduce risk, but they do not by themselves establish conformity or regulatory compliance.
3. What changed around the event?
A curve or outlier becomes much more useful when it carries context. Did the event follow a restart? Was the material, mold, machine, auxiliary condition, or setup different? Was a process adjustment made? Without that context, the next shift may see the same graph and repeat the same investigation.
Build the habit of pairing process data with the job information and notes your team needs to interpret it. Use automatic records where the system supports them, and define the few manual entries that still matter. The goal is not more paperwork. It is a reliable history that lets another qualified person understand the event later.
4. Is this isolated or part of a wider pattern?
A machine-side view helps solve the immediate problem. A plant-level view helps determine its scope. Is the pattern limited to one job, mold, machine, or shift? Has it appeared in previous runs? Are other machines producing suspect parts for the same reason?
The Hub® brings data from networked CoPilot systems into a shared interface. Current Hub Process capabilities include historical process data, audit reports for process changes, plant-wide summary reports, plant-overview dashboards, and process statistics. That broader view can help engineers compare runs, managers prioritize attention, and teams preserve evidence beyond the moment a press alarm occurs. Feature availability depends on the selected package and system configuration.
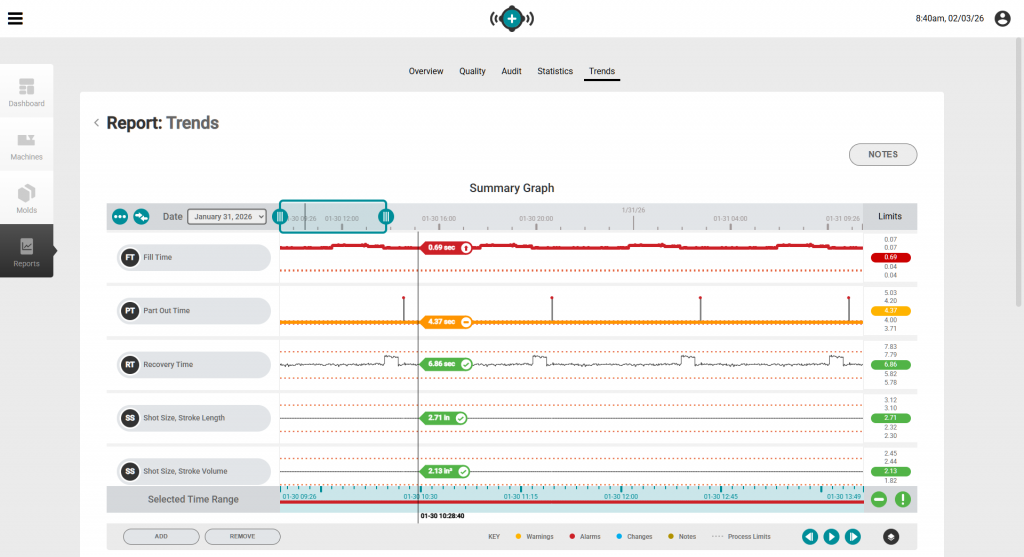
This division of work is important. CoPilot helps the team see process behavior at the machine and, where configured, support monitoring, containment, or control. The Hub helps the organization compare, retain, and use that information across a larger operating system. Together, they can connect the shot that changed with the plant decision that follows.
5. Did the response work, and can we repeat it?
A reaction is not complete when the alarm clears. The team still needs to confirm that the process returned to its approved condition, that parts meet requirements, and that the improvement held over an appropriate period. Then the learning should be reflected in the relevant template, process sheet, reaction plan, or training.
Historical comparisons and audit records make that verification easier. They also help separate a one-time recovery from a repeatable method. Over time, the plant can reduce its dependence on memory without diminishing the value of experienced processors. Their expertise becomes more teachable because the evidence behind a decision is available to the next person.
Build a small, closed data loop first
The strongest starting point is not a plant-wide collection project. Choose one recurring, costly problem and design a complete response around it.
- Define the part requirement and the business consequence of missing it.
- Identify the machine and mold signals that have a plausible, testable relationship to that requirement.
- Establish a baseline from capable production and confirm the relationship with part measurements.
- Assign who reviews an alert, what evidence they check, what actions they may take, and when the issue must be escalated.
- Verify the result, document the learning, and review whether the same method should be applied to another job or machine.
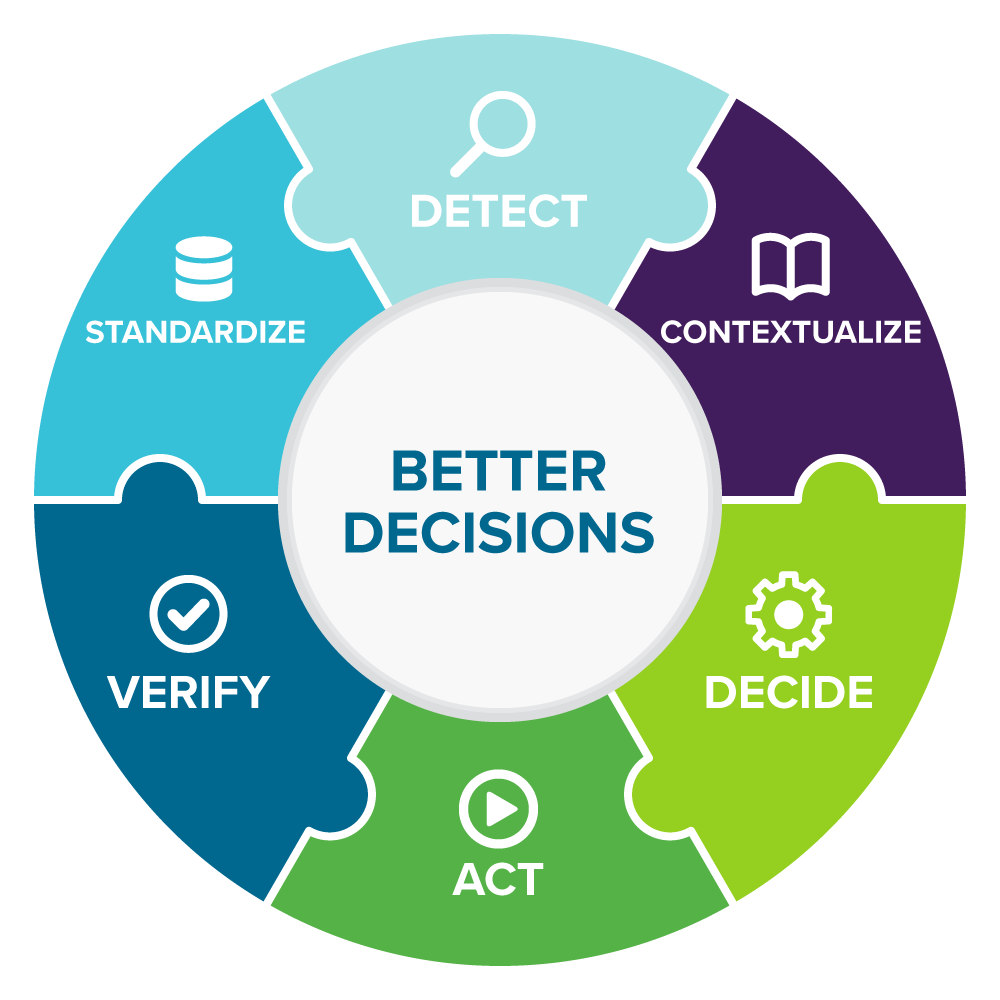
That loop turns data into an operating practice: detect, contextualize, decide, act, verify, and standardize. The technology supports the loop, but ownership, process knowledge, and disciplined review make it useful.
Make your next data investment answer a real production question
Explore CoPilot® for shot-level process monitoring and control, and review The Hub® for plant-wide data management and analysis. If your team needs help defining the right signals, workflow, or rollout, request a consultation with RJG.
Want to look at what data can do yourself? Check out the ROI Calculator tool for plotting your next savings.
Interested in discussing how this can impact your operations?