Tip of the Day 77: Where do the Alarm Levels Come From?
As most of you have seen when you “Add an Alarm” (or warning) to the “Alarm Settings” tool on the eDART it will automatically put in “Above” and “Below” (high and low) levels. When the value goes above the “Above” or below the “Below” then the parts will be rejected by the part diverter.
How does the Alarm Settings tool pick those levels?
Answer:
It looks at the previous 20 values for the alarm you are setting and picks levels that are the “mean ±4.5 x standard deviation”.
For those of you not familiar with statistical terms, don’t panic. Here’s the skinny on it.
In statistics “standard deviation” as a number that is computed from a set of values by running those values through an equation. The value that pops out (abbreviated with the Greek letter sigma, ó ) tells you how much the set of values vary among themselves. The larger the number the more “fuzzy” the data (on a Summary Graph, for example). The word “mean” is just another word for the average.
Thus when you add an alarm to the Alarm Settings tool it computes the average value and the standard deviation value for the previous 20 shots. It then multiplies the standard deviation by 4.5, adds it to the average and sets that as the high level alarm (“Above”). It subtracts standard deviation from the average and sets that as the low level alarm (“Below”). It does the same thing with warnings except that it uses mean ± 3 x ó for the levels.
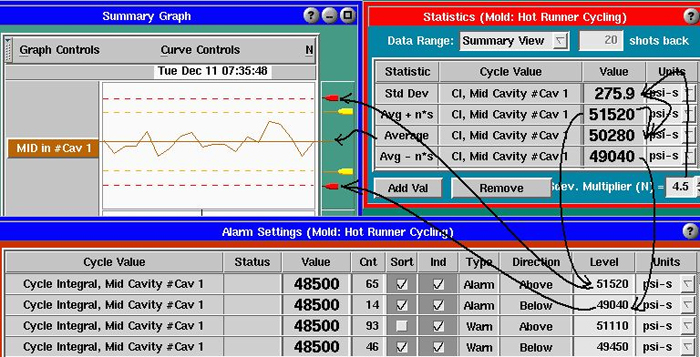
The graphic below explains this by using the Statistics window to show where the values come from. The Statistics tool is not required to add alarms, just to show statistics after the fact.
Notes, Cautions and Warnings
-
Always wait for the process to be stable 20 shots before adding alarms. Otherwise the startup variation will be used to compute standard deviation and the values will be wild and useless.
(We have completed a prototype of a tool for Alarm Settings that postpones the setting of alarms until the process stabilizes)
-
After the values are first chosen the Alarm Settings tool never changes the levels. You can do that by simply changing the numbers in the “Level” column or using the sliders on the Summary Graph.
- The number of shots and the number of “sigmas” (standard deviations) for both alarms and warnings can be changed by clicking the “Adjust Selected Levels” button on the Alarm Settings’ “Settings” menu. The 20 shots and 4.5ó and 3ó values are chosen from general experience and practice.
- Note that the alarm levels that are first picked do NOT represent any specific part characteristics. They are simply a way of capturing changes in the process. To determine whether a part is good or bad at a specific value you need to do a correlation study.
-
You may use the statistics tool to choose alarm levels different than the ones that the Alarm Settings tool has picked. If you have put the +N*Stdev and -N*Stdev values up and have the “Data Range” set to “Summary View” you can zoom in to the portion of the Summary Graph that you think is most representative of the process. Then read the values and enter them for the alarms. You can change the sigma multiplier at the lower right.