
What Makes the CoPilot so Special?
The CoPilot® is an injection molding process monitoring and control software that allows users to view and record data from the machine and mold. They can see what’s happening from the plastic’s point of view through the use of sensors placed in the mold. Each CoPilot networks to The Hub®, allowing users to instantly access an overview of how each machine is performing from anywhere in the world. They are able to access historical data, run audits, and view data trends over time.
Features of the CoPilot
- Enhanced cycle and summary graphs
- Monitor machine process
- Monitor cavity pressure sensors (Strain Gauge and Piezo)
- Transfer the machine from fill/pack to hold (V to P using cavity pressure)
- Cavity balance view tool to help balance hot runner molds
- Networked to The Hub® server for data archiving and viewing
- Templates for process match and troubleshooting
- Abnormal part containment
- Excessive rejects control
- Process change logs
What Makes CoPilot and The Hub Unique
Enhanced cycle and summary graphs:
The CoPilot offers enhanced cycle graphs with easy zoom and cycle comparison features. The summary graph offers tools to help find hidden alarm cycles and changes. It also allows users to set up new jobs, view multiple data sets at once, customize dashboards, and view historical data through a whole new customer experience. They can choose between classic cycle graphs and new, easy-to-read bar graphs.
Job overview screen:
The job overview screen offers easy-to-use features that isolate data and help compare a single cavity to the template. Additional bar graph displays help visualize data across multiple cavities.
Process change logs:
Users no longer have to dig through suspect parts or wonder what happened to a process the night before—access detailed process logs to know exactly who changed the process, why, when, and how. This eliminates the guesswork that often stems from unexpected changes.
Automated job audit reports:
Automated job audit reports mean that users no longer have to manually audit processes. They can access these reports at any time during or after a run. Initial and ending alarm limits, changes, and events tell them how many reject parts occurred and if anyone changed the alarm limits during a run.
Get a quick snapshot:
Quickly see which machines produce the greatest percentage of reject cycles, longest down time, most alarms, most cycles, and more. This will help direct efforts to machines that cause the most issues and can help pinpoint problems to prevent future occurrences.
Technical Advantages of the CoPilot
- Fully supports multi-touch touchscreens, which enhances the user experience
- Supports a total of 60 sensors with one CoPilot—no need to upgrade the hardware of the unit as needs and cavitation change
Traditional Features We All Know and Love
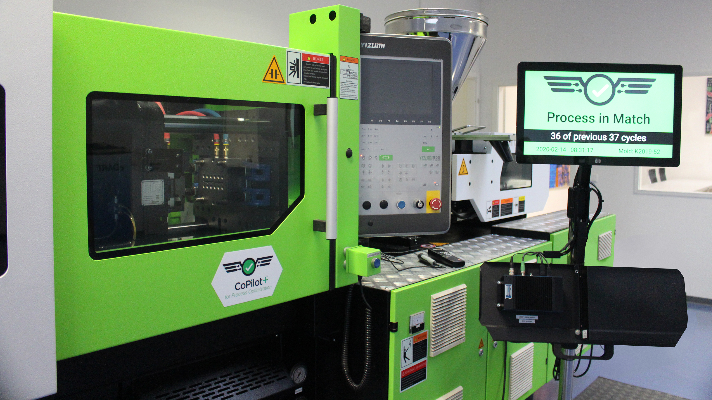
Get important information at a glance:
Know the moment a process strays off template and how many cycles have been producing reject parts from across the plant floor. Bright red and green screens immediately notify users how each press is performing in real time. If the screen turns red, the machine is producing reject parts and needs attention. That means plant managers can see how each machine is performing from afar—no more walking the aisles.
Dive into the details:
See exactly which settings are off template with the job overview screen. Is the viscosity too high? Is the hold time too short? Job overview screens show which settings are off template so users can get to the root of the problem up front. No more button pushing.
Access real-time data from anywhere:
The Hub allows for remote monitoring, historical data analytics, and more. Users can instantly know which machines are running, down, or producing reject parts. Exporting reports allow users to view and share historical trends and reoccurring problems to prove processes and reduce liability. Newly designed Process Audit Report eliminates manual process, saving significant time and resources.
Review and replay historical data:
Replay cycle graphs from any time in history to prove processes, see trends over time, and see where processes were adjusted. Zoom into specific points in a single shot or zoom out to view all data over time.
Coming Next
- Industry 4.0 Connectivity with Industrial Ethernet Connections, allowing other molding cell devices to be connected to the CoPilot
- Valve Gate control
- Machine Thermocouple interface
- Mold Thermocouple interface
- Redesigned notes feature for logging/reviewing summary notes