
Tolerances, Shrinkage, and Process Strategies

“Just make the part to print, that’s all.”
We’ve all heard this statement before, right? But it’s not that simple. Engineering a quality part, mold, and process requires a significant understanding of all the plastic and machine variables.
Though there are many strategies to processing plastics, RJG has developed three methods that are each effective in different scenarios—DECOUPLED MOLDING I, II, and III. It’s important to review each method to ensure you pick the right one for your application.
Let’s take a sample part and review the part design, material selection, mold design, and real processing data for each method to determine how using DECOUPLED MOLDING I, II, or III affects the outcome of the part and which method would be the most effective in this application.
Part Design
For the purposes of this article, we are using an ASTM Tensile Test Bar D638 V, shown below in image 1.
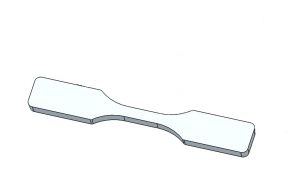
The Tensile Test bar is used to generate many of the values that are found on a technical data sheet. In the next section, we will focus on several of those values.
Material Selection
There are thousands of materials available on the market, but for now we’ll follow the K.I.S.S. (keep it simple, stupid) principle. However, to ensure that we capture a vast portion of the industry, our selections need to cover both amorphous and semi-crystalline materials. Let’s use Toyolac 100 (ABS) and Exxon AX03BE3 (PP).
| Toyolac 100 | Exxon AX03BE3 | |
| MFI g/10 min | 15.0 | 35.0 |
| Melt oF | 446 to 482 | 392 to 572 |
| Mold oF | 104 to 176 | 60 to 150 |
| HDT oF | 181 | 131 |
| Shrink Rate in/in | 0.004 to 0.006 | 0.010 to 0.025 |
Table 1: ABS vs PP
Heat Deflection/Distortion Temperature (HDT) is the temperature at which a material will deflect under load. Mold designers and simulation users apply this value when designing the cooling channels for the mold. Molders use this value as a target to ensure the part is rigid enough to not get white stress marks, pin push, or (if you’re really lucky) pierce the part with the ejector pins because the part is too soft. As hot plastic gives up its heat, the molecules want to contract back to their original relaxed state—this is commonly called shrink rate.
Mold Design
The mold used for testing purposes is an 8-cavity H pattern cold runner with lapped edge gates built by Extreme Tool and Engineering (shown in image 2). The mold is instrumented with RJG’s multi-channel button pressure sensors and flush mount temperature sensors to allow us to see inside the cavity and correlate data with molded parts.
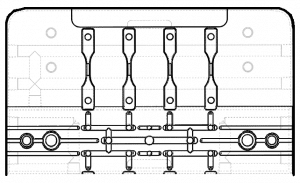
The cavity length is 2.4800 inches, width is 0.3690 inches, and thickness is 0.1330 inches.
Processing
DECOUPLED MOLDING® is how the process separates the fill, pack, and hold phases. Each has its own purpose, but we will get to that momentarily.
We must recall that the molding machine can control the injection of material with speed or pressure as the controlled variable. The controlled variable depends on how we segregate the phases and which other variables are driving the proverbial bus.
Decoupled I is essentially a drag race to get material to the end of the cavity as fast as possible. It is most often used for thin wall molding, which typically anything under 0.060 in. That’s because thin wall parts freeze very quickly, and in order to fill the cavity, we must inject as fast as possible with very high pressure to prevent short shots. Here filling/packing/holding is controlled by injection velocity because the material slows down and the flow front freezes, yielding a short shot.
When using the industry standard Decoupled II, the filling is controlled by velocity, while pack and hold are controlled by pressure.
For critical parts, Decoupled III is typically selected. Filling is a set, fast velocity (often referred to as V1), packing is a slower, controlled velocity (often referred to as V2) and holding is a fixed pressure setpoint.
To ensure consistency across all processing strategies for this test, an end of cavity of 3,000 PSIp was maintained.
Below (Table 2) are the actual temperatures for the established robust Decoupled II process.
| Toyolac 100 | Exxon AX03BE3 | |
| Melt Temperature | 449 | 435 |
| Mold oF | 131 | 72 |
| Ejected Temperature oF | 176 | 123 |
Table 2: Process Temperatures
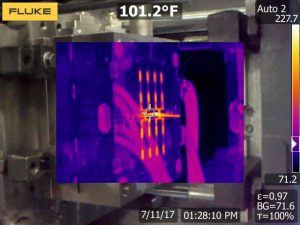
To ensure the part is below the HDT, we utilize thermal imaging to capture all cavities. Thermal management is critical to maintain part quality over time.
Data, Data, Data, and More Data
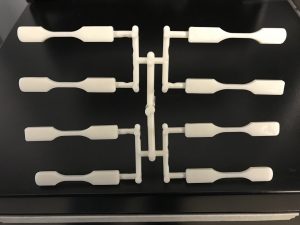
For continuity between all data, we chose to use cavity 8 for all measurements because it will have the highest variation due to shear imbalances. This cavity is located in the lower left corner of Image 4.
The cavity overall length (OAL) is 2.4800 inches so all dimensional data will be based against this value.
Dimensional
| Toyolac 100 Part Size (in) | |||
| High | 2.4600 | 2.4650 | 2.4645 |
| Average | 2.4596 | 2.4646 | 2.4641 |
| Low | 2.4585 | 2.4640 | 2.4640 |
| Range | 0.0015 | 0.0010 | 0.0005 |
| Standard Deviation | 0.0005 | 0.0004 | 0.0002 |
| Shrink Rate (in/in) | |||
| Maximum | 0.0087 | 0.0065 | 0.0065 |
| Average | 0.0082 | 0.0062 | 0.0064 |
| Minimum | 0.0081 | 0.0060 | 0.0062 |
| Range | 0.0006 | 0.0004 | 0.0002 |
| Exxon AX03BE3 Part Size (in) | |||
| DI | DII | DIII | |
| High | 2.4375 | 2.4520 | 2.4520 |
| Average | 2.4372 | 2.4514 | 2.4516 |
| Low | 2.4360 | 2.4510 | 2.4515 |
| Range | 0.0015 | 0.0010 | 0.0005 |
| Standard Deviation | 0.0005 | 0.0004 | 0.0002 |
| Shrink Rate (in/in) | |||
| Maximum | 0.0177 | 0.0117 | 0.0115 |
| Average | 0.0173 | 0.0115 | 0.0115 |
| Minimum | 0.0171 | 0.0113 | 0.0113 |
| Range | 0.0006 | 0.0004 | 0.0002 |
A Decoupled I process shows the largest shrink rate. This is because the wall freezes very quickly and does not allow for typical packing that compensates for shrinkage. Based on the material guidelines, the actual shrink rate is outside those limits by 0.0022 in/in. for the ABS. In comparison, the PP falls within the range near the center of the supplied range. When reviewing the changes in OAL, it has a range of 0.0015 inches.
Now let’s review how the material performed utilizing a Decoupled II strategy. For the ABS, the shrink rate is smaller but still outside the range provided by the material supplier by 0.0002 in/in. The same trend for shrink rate is observed in PP, but now is 0.0015 in/in above the minimum shrinkage expected. With both materials, there is a reduction in OAL range of measurements from 0.0015 inches to 0.0010 inches. The average length for the ABS was 0.005 inches longer, while the PP grew 0.0142 inches compared to its Decoupled I counterpart.
Onward to explore the results from the Decoupled III process. For both resins, the shrink rate is nearly identical, but the range in part OAL is reduced from 0.0010 inches to 0.0005 inches compared to a Decoupled II process. If we review the part weight changes in PP and ABS, they are alike. This process has the tightest range for two reasons. First, both filling and packing phases are velocity controlled, allowing the machine to use the pressure needed to maintain the set velocity. This allows for 2 of 3 phases to compensate for changes in the material automatically by the machine. The second reason is the control of transfer is managed by the cavity pressure sensor not the screw position on the molding machine.
Part Weight
| Toyolac 100 Part Weight (grams) | |||
| DI | DII | DIII | |
| High | 1.3945 | 1.4679 | 1.4669 |
| Average | 1.3934 | 1.4675 | 1.4667 |
| Low | 1.3921 | 1.4671 | 1.4665 |
| Range | 0.0024 | 0.0008 | 0.0004 |
| Standard Deviation | 0.0009 | 0.0003 | 0.0001 |
| Exxon AC03BE3 Part Weight (grams) | |||
| DI | DII | DIII | |
| High | 1.1301 | 1.2574 | 1.2573 |
| Average | 1.1292 | 1.2568 | 1.2570 |
| Low | 1.1280 | 1.2560 | 1.2562 |
| Range | 0.0021 | 0.0014 | 0.0011 |
| Standard Deviation | 0.0007 | 0.0004 | 0.0004 |
For a Decoupled I process, the trend was essentially the difference between amorphous or semi-crystalline resins with weight varying 0.002 grams. One item we must take into account is that this part would likely never be molded using this process strategy as it’s not considered thin wall.
In a Decoupled II, part weight for both materials show an increase. For ABS it’s 0.07 grams and 0.13 grams (shown in image 5). These changes occur because of the pack/hold phase using a constant pressure to cram more polymer chains into the cavity to compensate for naturally occurring shrinkage that occurs during cooling.

The weight gain shifting to a Decoupled III process is 0.0008 grams for ABS and 0.0002 grams for PP.
Conclusion
In short, a Decoupled I process is best used for thin wall molding applications, Decoupled III is best for high tolerance molding, and Decoupled II is the industry standard for the majority of molded parts.
Trying to validate a part with the tight tolerances of ±0.002 inches and Cpk of 1.67 is going to be nearly impossible, as the variation in OAL is using nearly the total tolerance* band. The tried and true Decoupled II process will work for most projects, as it produces parts with a range in OAL of 0.001 inches and a tolerance of ±0.002 inches, which would allow us to validate with a Cpk of 1.33, but not 1.67. The Decoupled III has a variation in OAL of 0.0005 inches, allowing a tighter tolerance of ±0.001 inches and a Cpk of 1.33.
Keep in mind this is a very simple part with a single gate. As the project becomes more complex, choosing the correct process strategy is critical so the appropriate shrink rate can be cut into the mold cavity. This isn’t easy… but if it was, everyone would do it. Sit down as a team of part designers, mold designers and molders and have healthy discussions so the project can be on time, under budget, and right the first time.
Nothing is impossible, we just need to do our due diligence as engineers.