
How to Develop a Robust Design for Successful Manufacturing
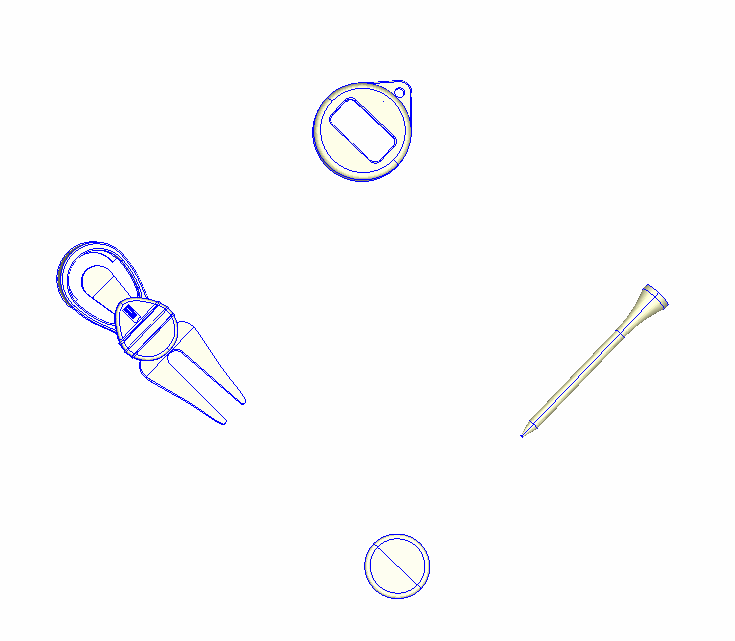
There are a lot of moving parts when it comes to injection molding part and mold design. Between product design, material selection, mold design, and processing, collaboration is key to ensure a successful project. There are hundreds of areas that need to be covered on each of those projects, but we are going to focus on the stages of product design and launch. We will do this by walking through the steps we took to create what would have been our giveaway for NPE 2021: golf tools (Image 1).
Design for Manufacturing Concerns
There are many areas that we need to look at when evaluating a part for draft: radius, datum, dimensions, tolerances, quoted cycle times, and potential non-conformities for molding or assembly. For this project, we looked at all of those areas, but there were three main concerns we watched out for.
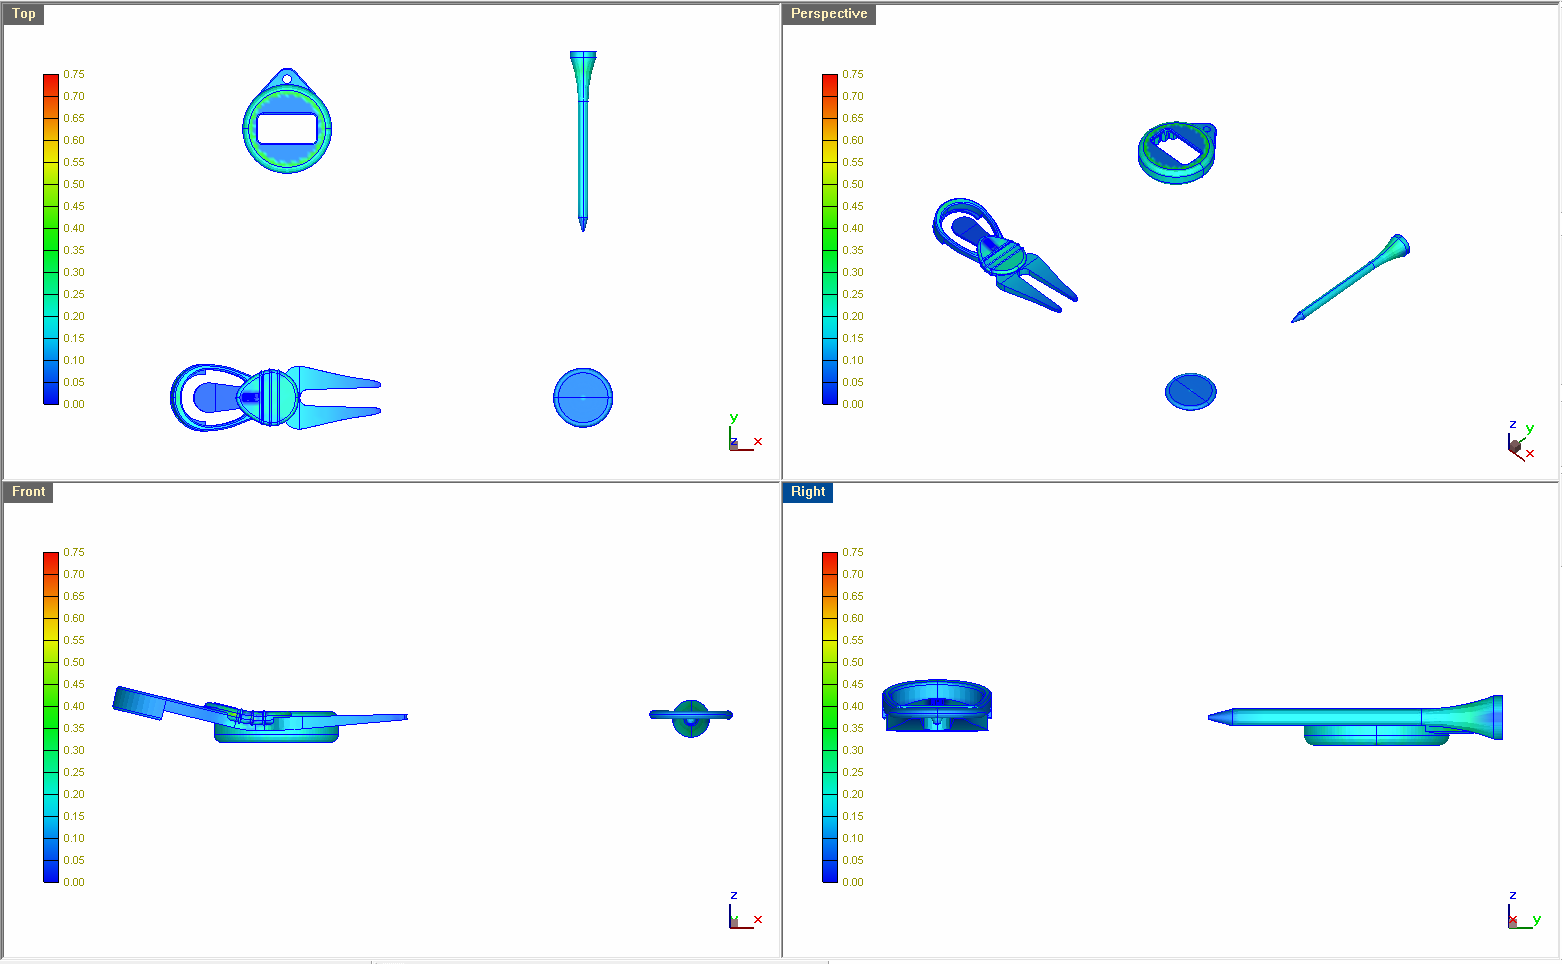
1. Wall Thickness: In the golf part, wall thickness varies from 0.020 in. (0.508 mm) to 0.750 in. (19.05 mm) depending on area (shown above in Image 2). This presents issues with fill/pack/cool, yielding high risk for differing shrink rates, warp, sinks, and voids. That meant we needed to modify the parts to allow for a mold with no actions. This was done by changing the geometry and adding draft.
2. Assembly: Another concern we had was being able to fit the ball marker into the divot fork upon assembly. Ideally, they would be one piece instead of rattling around loose in the golfer’s pocket.
3. Accuracy: The last area of concern was the straightness of the tee. Let’s be honest, when I hook a ball, I blame the club, the ball, the weather, or maybe even the tee… anything but my terrible swing. So it was important that we got the tee perfectly straight to remove that as a possibility for blame.
In-Mold Rheology
In-mold rheology can be used to improve the simulation material characterization files. This allows for the most accurate simulations to help ensure we understand what’s going to occur in the molding process and how to head off any issues before we cut steel.
The focus of in-mold rheology is to understand the accuracy of the values in the simulation material file for viscosity and thermal properties. Show below in Image 3 is a poly carbonate material from within the simulation software showing the two viscosity parameters we will be evaluating.
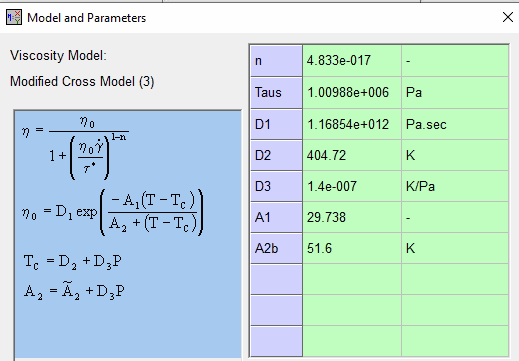
These values impact the slope of the cavity pressure curve in simulation as well as the arrival time of the melt front to a sensor node in the simulation.
To complete this testing, we have a spiral mold with a constant thickness equipped with cavity pressure and temperature sensors (show below in image 4).
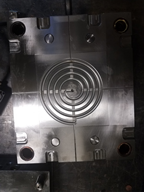
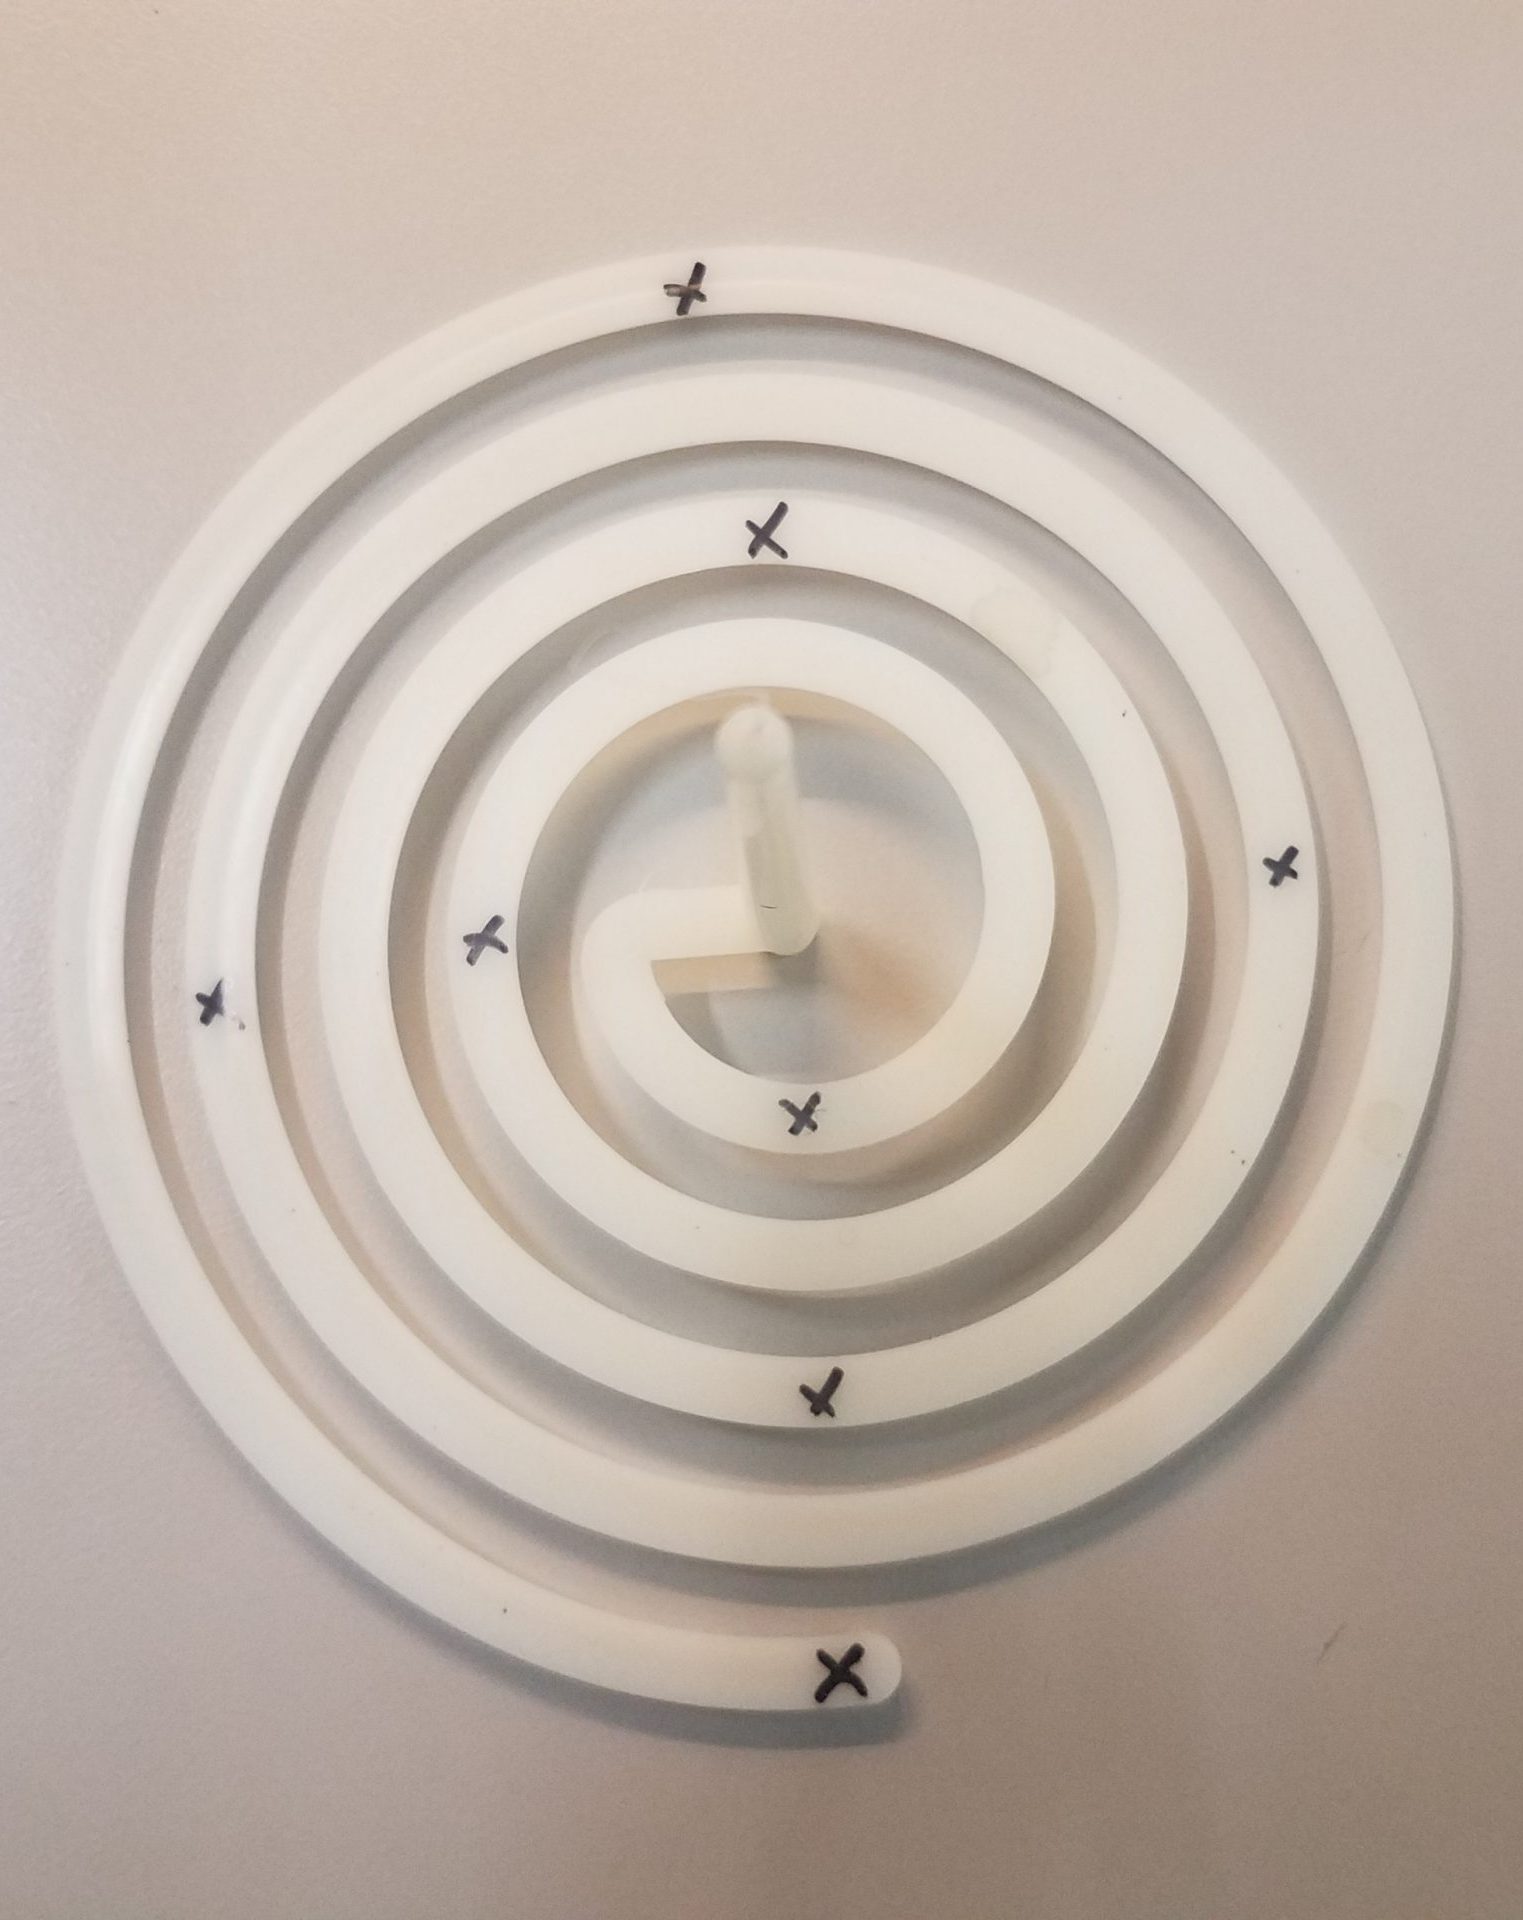
Image 4: X marks the spot for sensor locations
There are several instances when we want to look at utilizing in-mold rheology:
-
For relatively new materials
-
If material file in simulation has not been updated for an extended period of time
-
To understand how different additives impact processing (which impacts part performance)
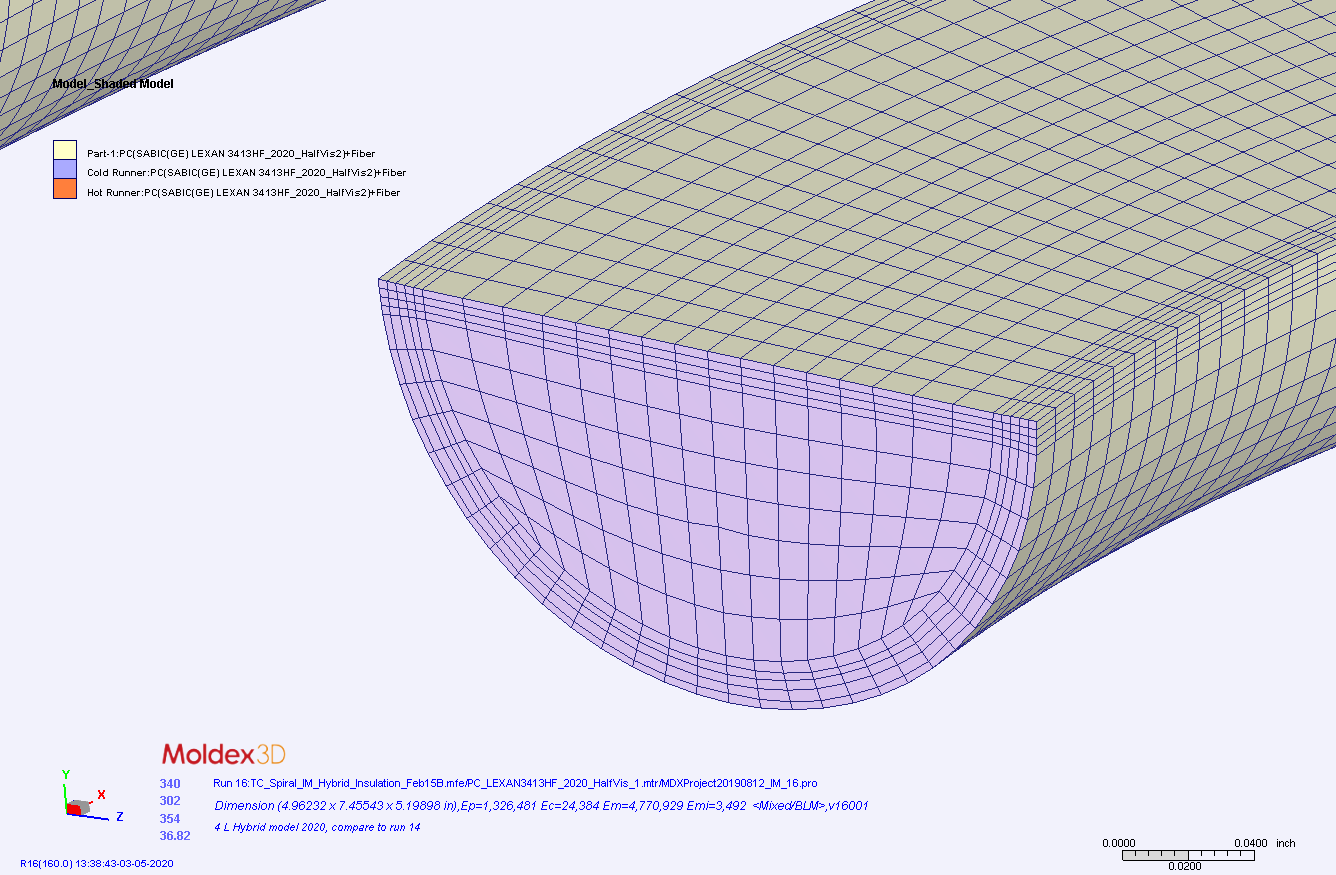
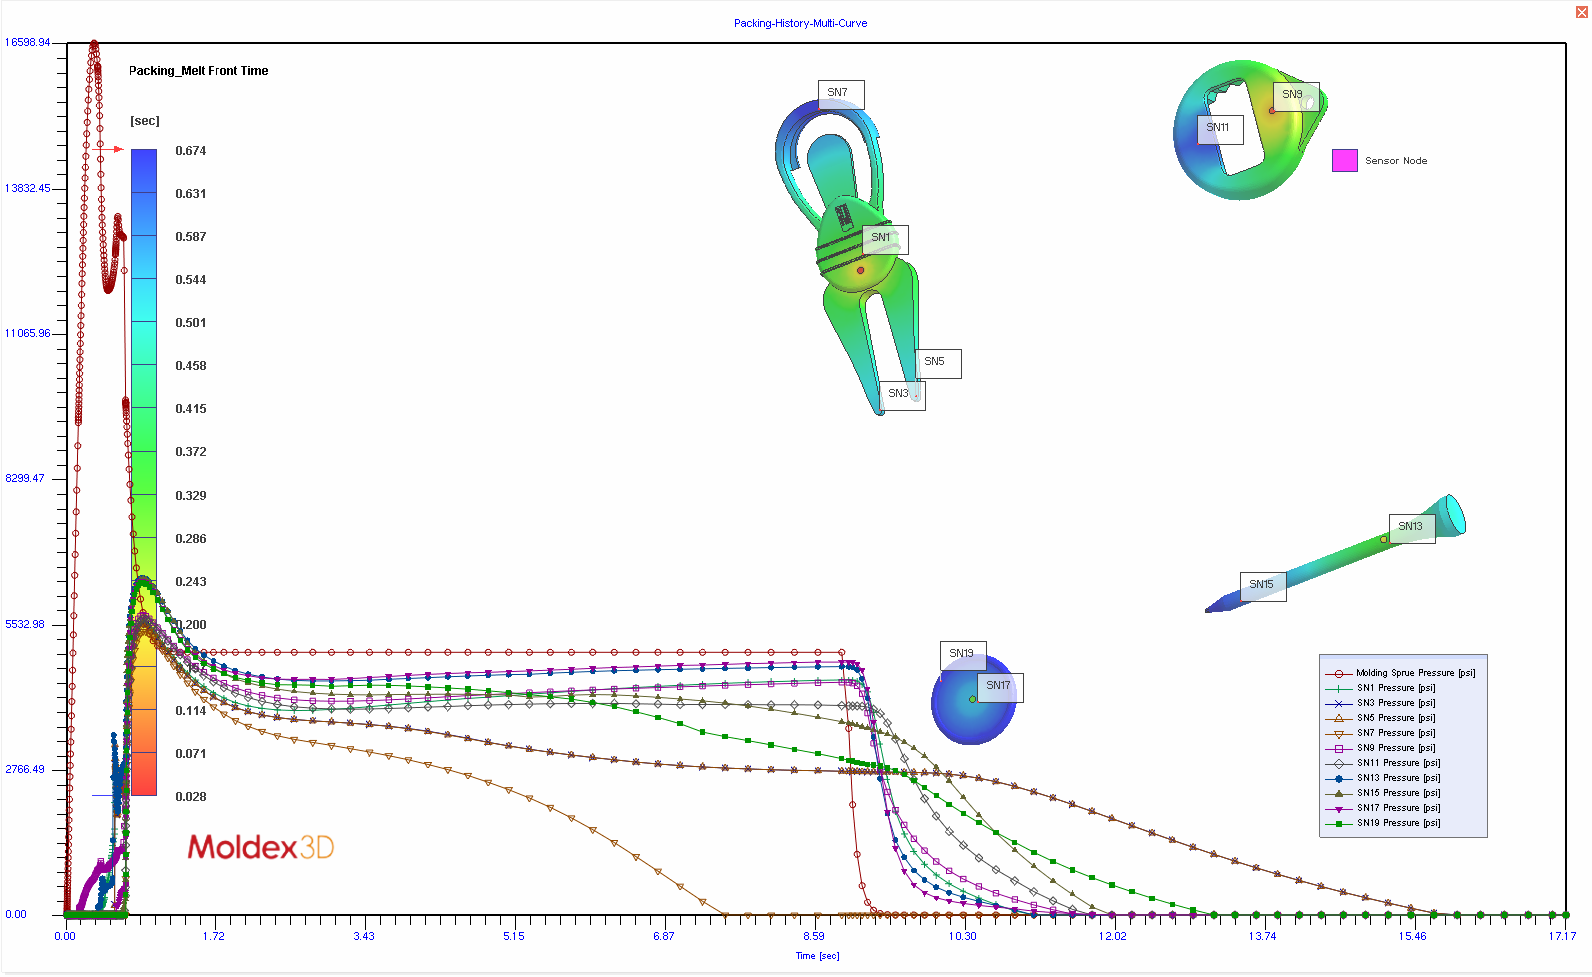
When setting simulation for in-mold rheology we used 15 layers within the mesh model to improve accuracy (shown below in image 5). The sensor nodes within the mesh model replicate the placement of sensors in the actual mold, so we have the best data set possible.
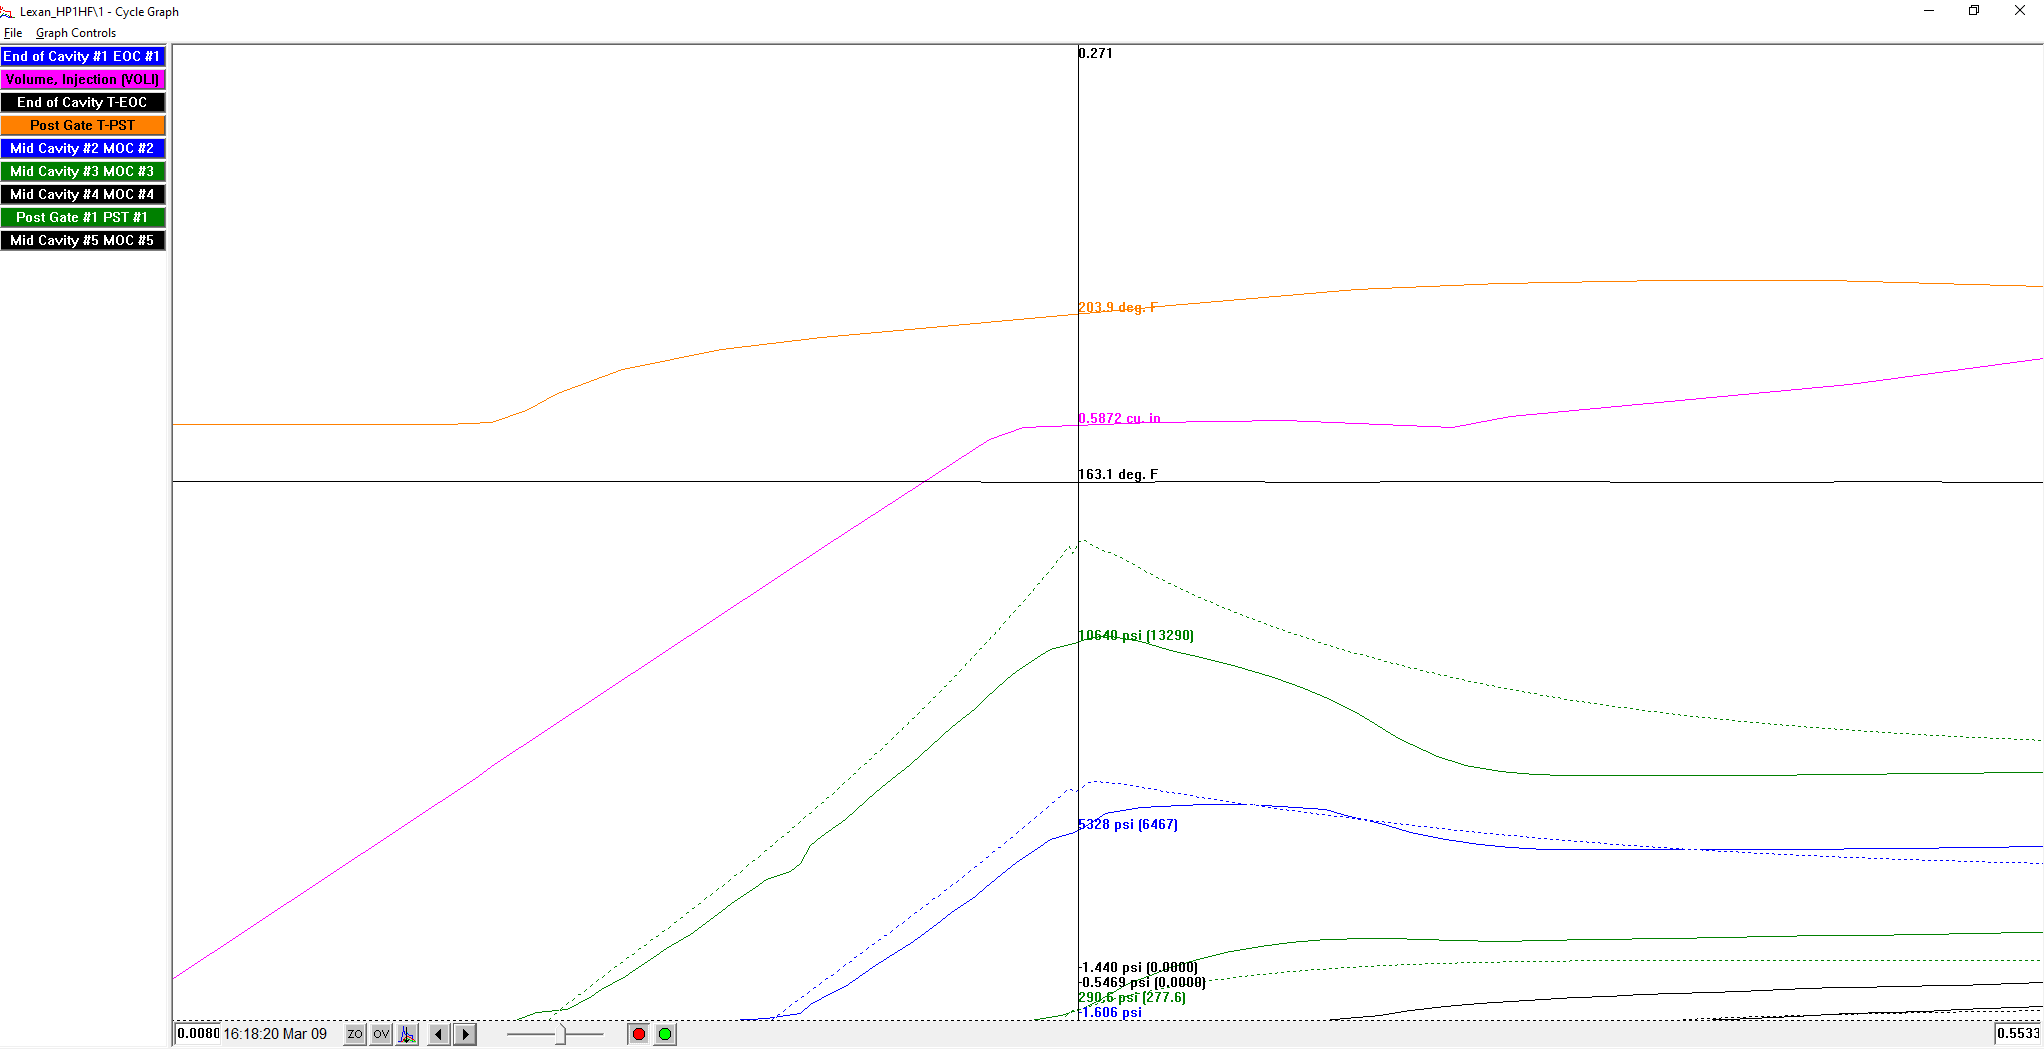
We then ran a baseline simulation with the unaltered material file to determine what shifts need to be made and by how much. In image 6 below, the dotted line is the template that we generate in simulation and then download into the eDART so we could compare. The solid line of the same color represents the actual sensors data. For now, we will just focus on the viscosity properties, and we can see that the arrival time and slope of the curves during filling are a touch off.
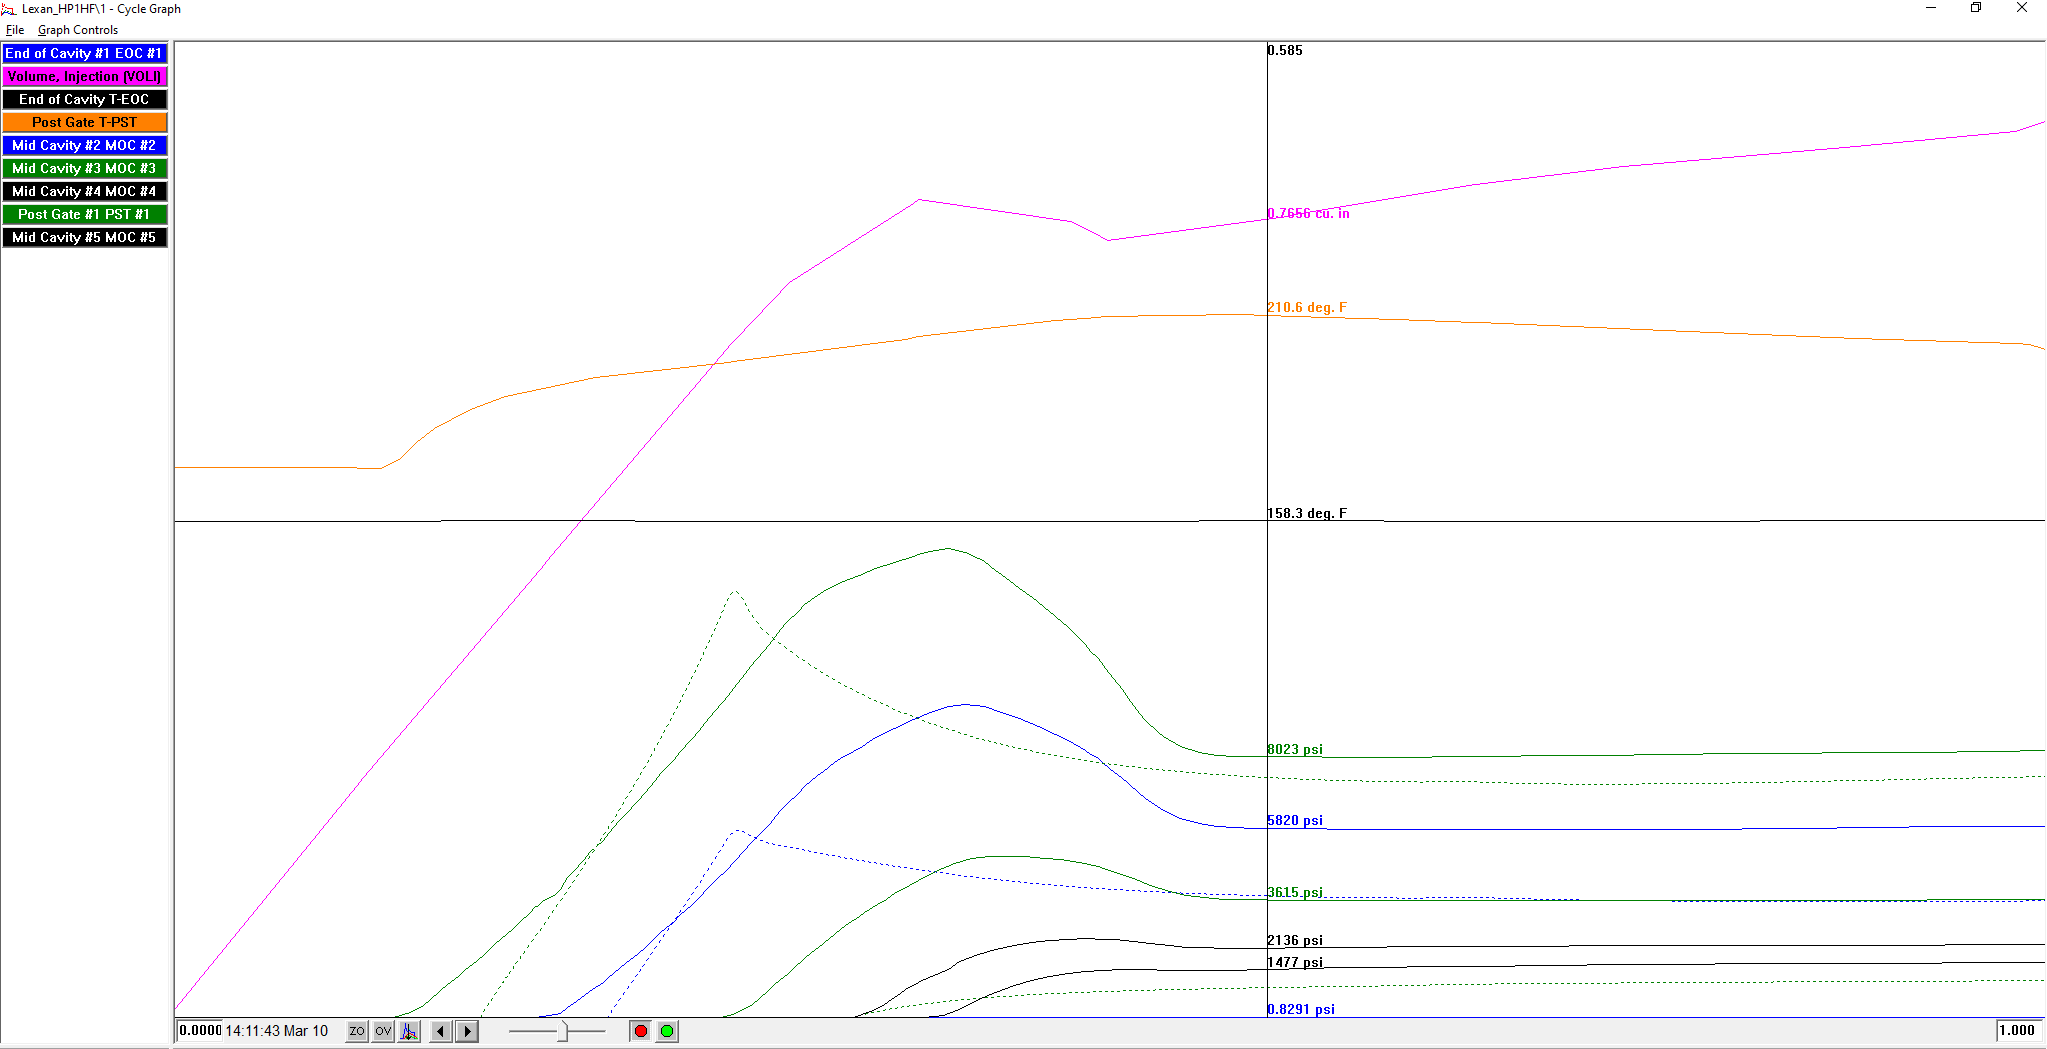
After this initial run, we made adjustments to the viscosity parameters to improve the arrival time and slope of the simulation to best fit reality. We see below in image 7 that after these adjustments, the arrival time is nearly identical, and the slope during filling is much closer. We followed a similar protocol to evaluate thermal conductivity during the cooling phase.
Material Selection
When considering material selection for the golf part, there were several things to think about. The part will be a one-time or limited use, so there were no true functional requirements to consider. We also wanted a minimal carbon footprint with the best parts and lowest possible scrap.
We carefully analyzed our resin options:
-
Fossil Fuel Base: Less expensive, easier to acquire and color
-
Biodegradable: Expensive and difficult to color but Earth friendly
-
ABS: Middle of the road material, flows well, releases easily from the mold
-
PC: Shows visually what’s happening internally with void formation and stress
-
PLA: The same resin the bottom of the K-cup is made out of
After working with our marketing department, we decided to test the following materials:
-
Fossil Fuel Based
-
PP – Exxon AX03
-
ABS – Toyolac® 100
-
-
Biodegradable (Image 8)
-
ABS – Trilac® ABS-RC3000
-
Polycarbonate – Trieco 3A00 I(R)
-
PLA (Polylactic Acid) – Terratek® BD5175
-
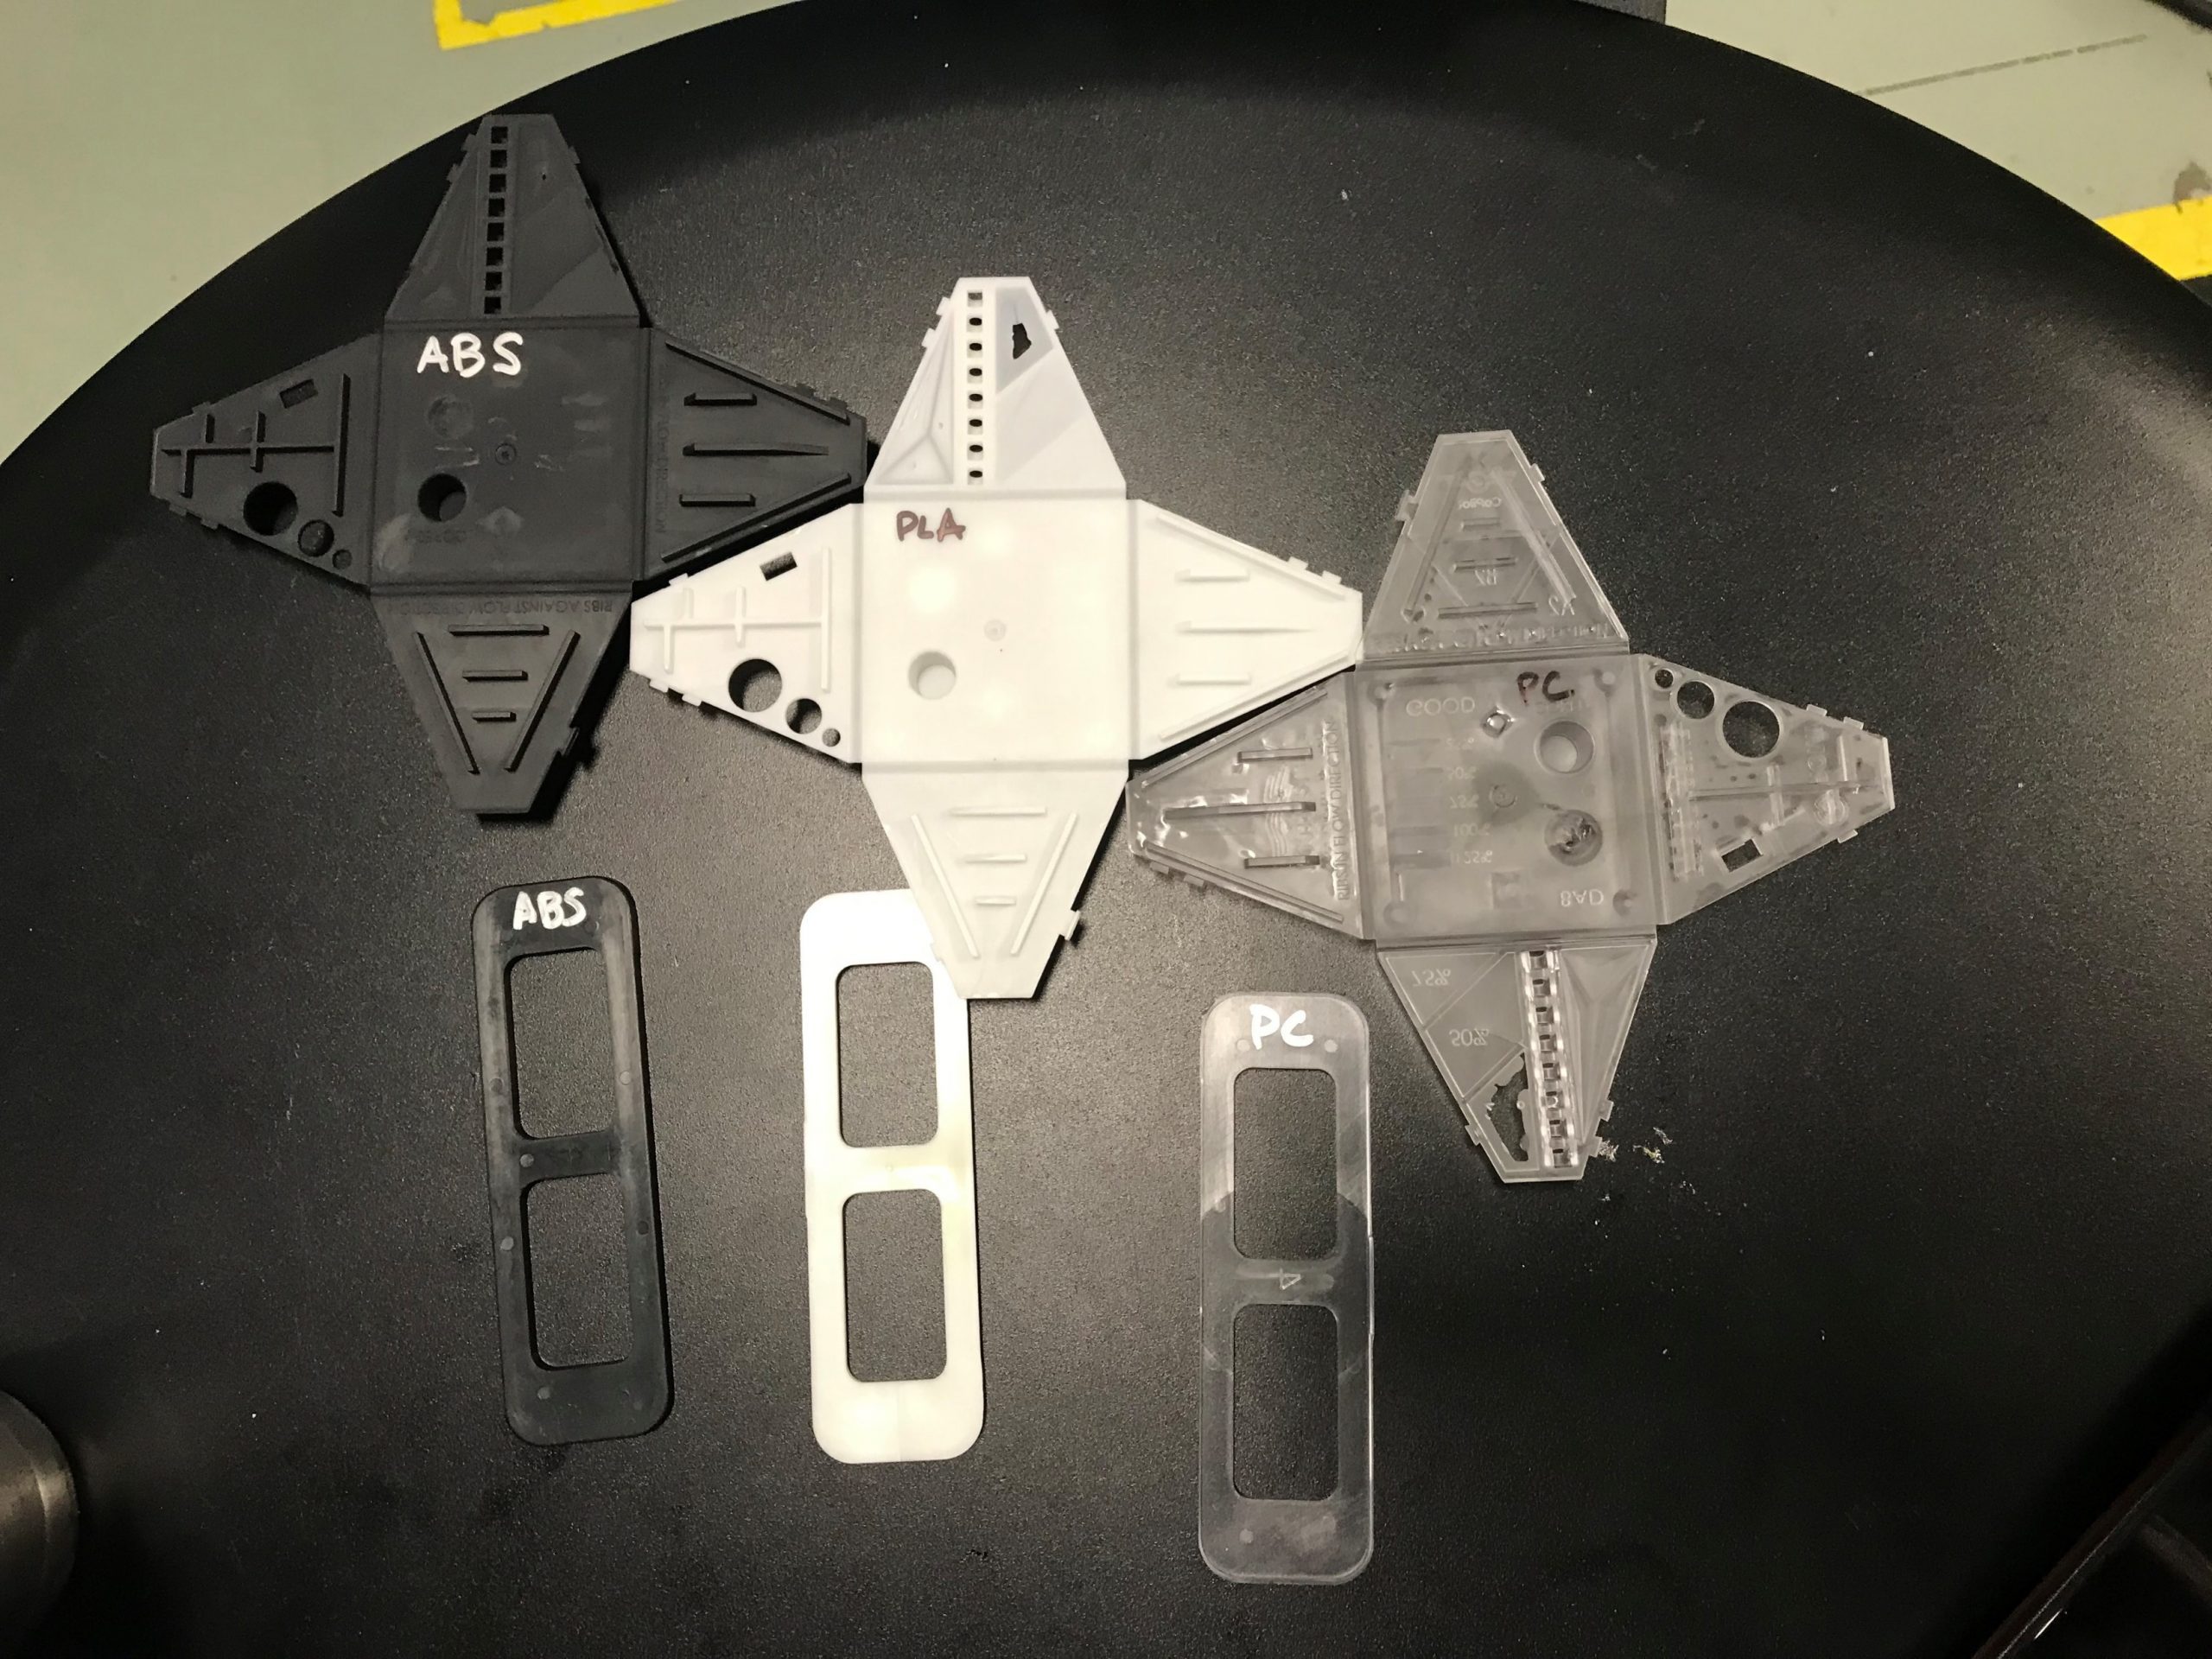
All things considered, we decided to move forward with the biodegradable ABS, which we will be running in multiple colors at NPE 2021. We will be working through the in-mold rheology exercise again to evaluate the impacts of the pre-colored material.
Mold Design and Molding Machine
Now we must begin to define the box we are working within. Several points need to be taken into consideration early on to eliminate the risk of degradation of additives, such as color, release agents, fibers, or even the base polymer chain, including:
-
Gate placement: should be in the thickest section (if feasible and does not create a safety hazard)
-
Size of gate: should be based on the wall thickness and shear rate
-
Shear heating of the resin
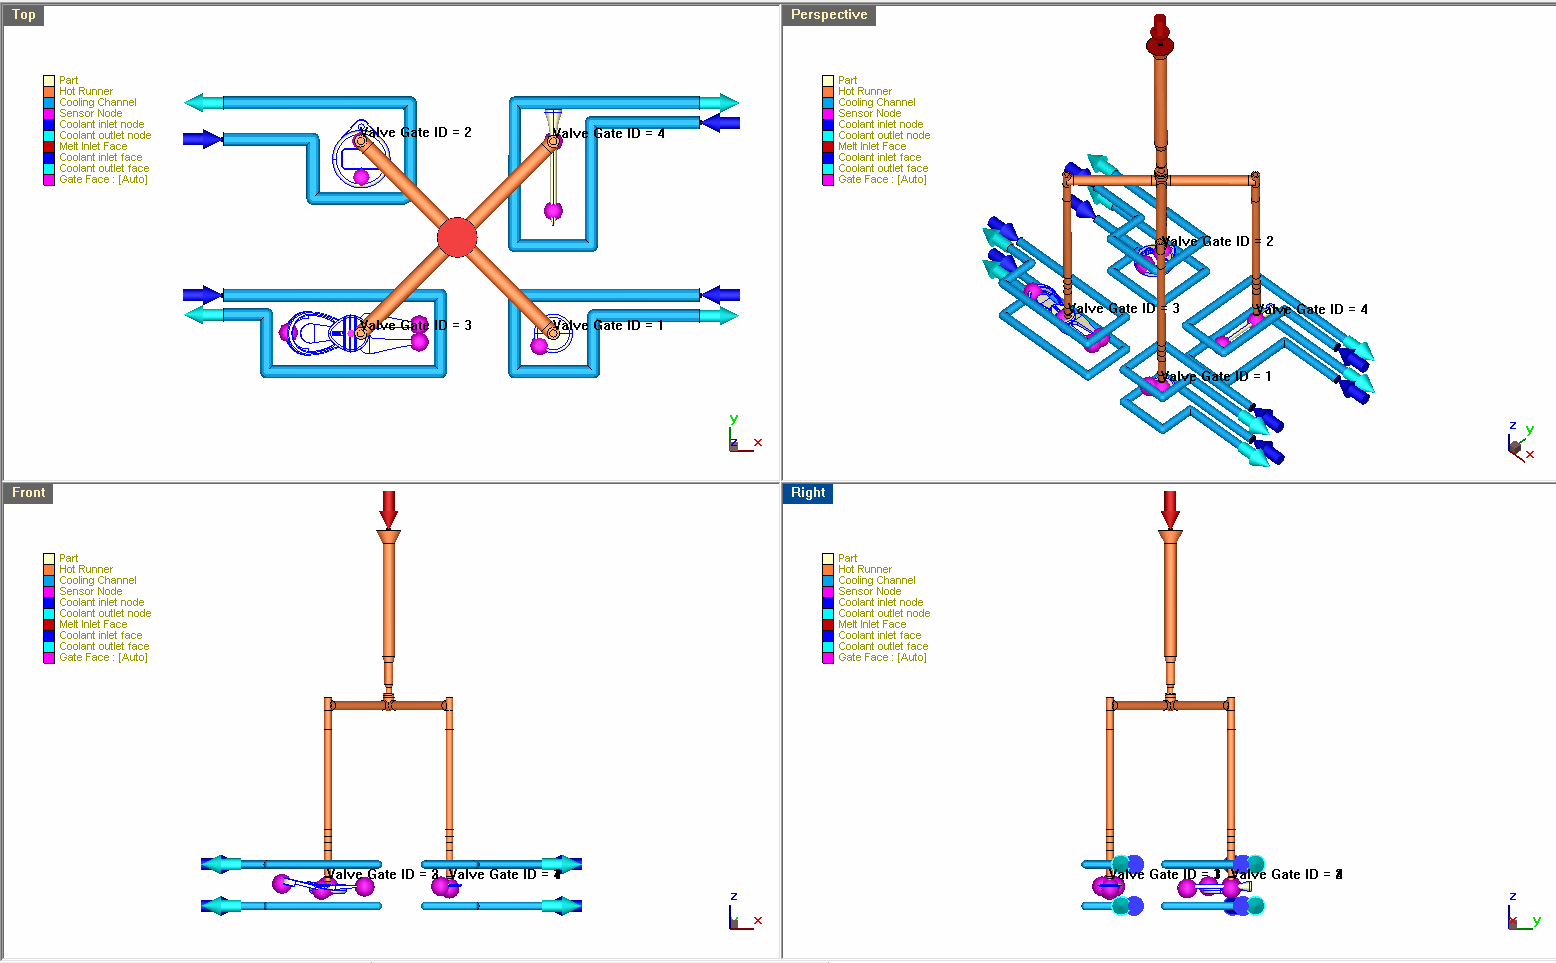
Water will be placed to achieve a uniform part and mold temperature across all four parts, shown in Image 9 below.
The mold will need to last decades and likely need to run many materials over the course of its existence. Some materials require low polish, while others require a high polish level. To be the most accommodating possible, we selected an H13 and coated it with a Nickle Boron to help reduce friction.
Machine limitations of shot size, flow rates, injection pressure, clamp tonnage, tie bar spacing, and mold height were also taken into consideration.
Support pillars will be placed under the high-pressure points within the cavity to minimize mold deflection and increase mold life. Cavity pressure sensors will be placed at end of fill to detect short shots and post gate to control the Decoupled III process, and cavity temperature sensors will be placed to activate valve gates based on the material flow front.
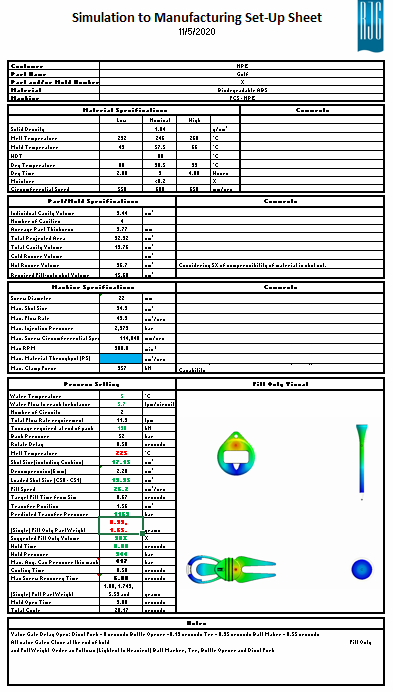
Processing
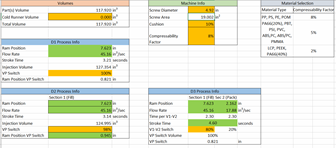
Before running a simulation based on material, tolerance, and other criteria, we need to determine what is the best process strategy. Image 10 below is an initial set-up sheet. We calculated shot size and flow rates based on the machine capability and material limitations. This helps to ensure that the number of simulation iterations is kept to a minimum, allowing for faster turn-around due to planning. We also calculated proper gate size based on wall thickness where the gate will be placed and maximum shear rate of the material and in conjunction with the machine flow rate capability.
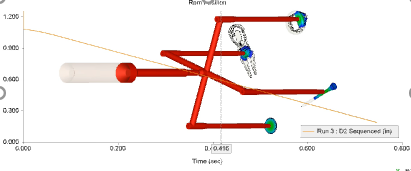
Due to the volume, thickness, and flow length differences, we chose to fill the parts sequentially (filling the thickest/largest volume first, while filling the smallest/thinnest last). The objective is for all four cavities to hit the end of fill at the same time (or as close as possible). In the simulation, we are activating valve gates based on sensor nodes. These sensor nodes will correlate with actual cavity temperature sensors that will detect the flow front of material and be activated through the eDART. By activating valve gates based on the flow front arrival, the process can handle much larger changes in viscosity (especially when running multiple colors in the same mold).
The moving boundary shown in Image 11 represents the movement of the screw during injection and helps to improve predicted accuracy of injection and cavity pressures. This is a standard Decoupled II process—we can see the screw moving but no material in the cavity yet. This is due to material compressibility (which varies in semi-crystalline and amorphous resin). This compression before movement increases required injection pressure and can impact accuracy if not modeled correctly. This sequence isn’t exactly what we want, but with another iteration, we can get all cavities to hit the end of fill at almost the same time.
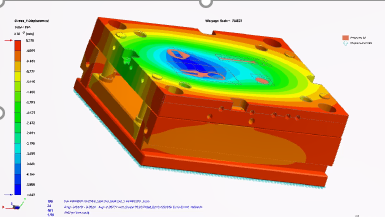
After that is complete, we can then simulate the mold deflection based on actual pressures in the cavity using the molding simulation. Below in Image 12, the analysis shows that there is minimal support and mold deflection of 0.0018 in. (0.048mm).
Outputs
We know that doing simulation work can head off issues, so it’s valuable if you’re running molds with or without sensors. If sensor technology is not used, we can output from simulation a set-up sheet for the machine(s) that the mold will run in, shown below in Image 13. With process development completed and a known process window, the time and cost spent getting the mold up running can be significantly reduced. Of course, small adjustments will still likely need to be made.
For molders who do utilize cavity or temperature sensor technology, there is another layer that gets even closer to better results. Not only would you get the process sheet we discussed previously, but we take the sensor curves generated in simulation and download them into the eDART® or CoPilot®. This now gives you a cavity template to follow rather than just machine variables. We all know that processing from the plastic’s point of view from in the mold cavity has the highest repeatability over time.
Conclusion
No matter the industry, material, machine, or process strategy, using tools like TZERO and sensors will help get you running consistent quality much faster (and we all know time is money).