
RJG Return on Investment for Big Parts > 1000 Grams
Logistics and capital investment are barriers to offshore and low cost competition that have enabled many US molders to see growth in the market segment of molding big parts. Molders of big parts have a very unique return on investment opportunity with the use of cavity pressure technology. This paper will explain that opportunity, supported with data from various case studies.
A significant reduction of normal process variation can be achieved with the use of RJG’s processing methodology, DECOUPLED MOLDING® III. This method incorporates velocity and cavity pressure control during the packing phase of the process to improve process robustness and part quality. All of the data generated in the following examples represents “before” and “after” scenarios from processes converted to this molding methodology.
Normal Dimensional Variation Reduced
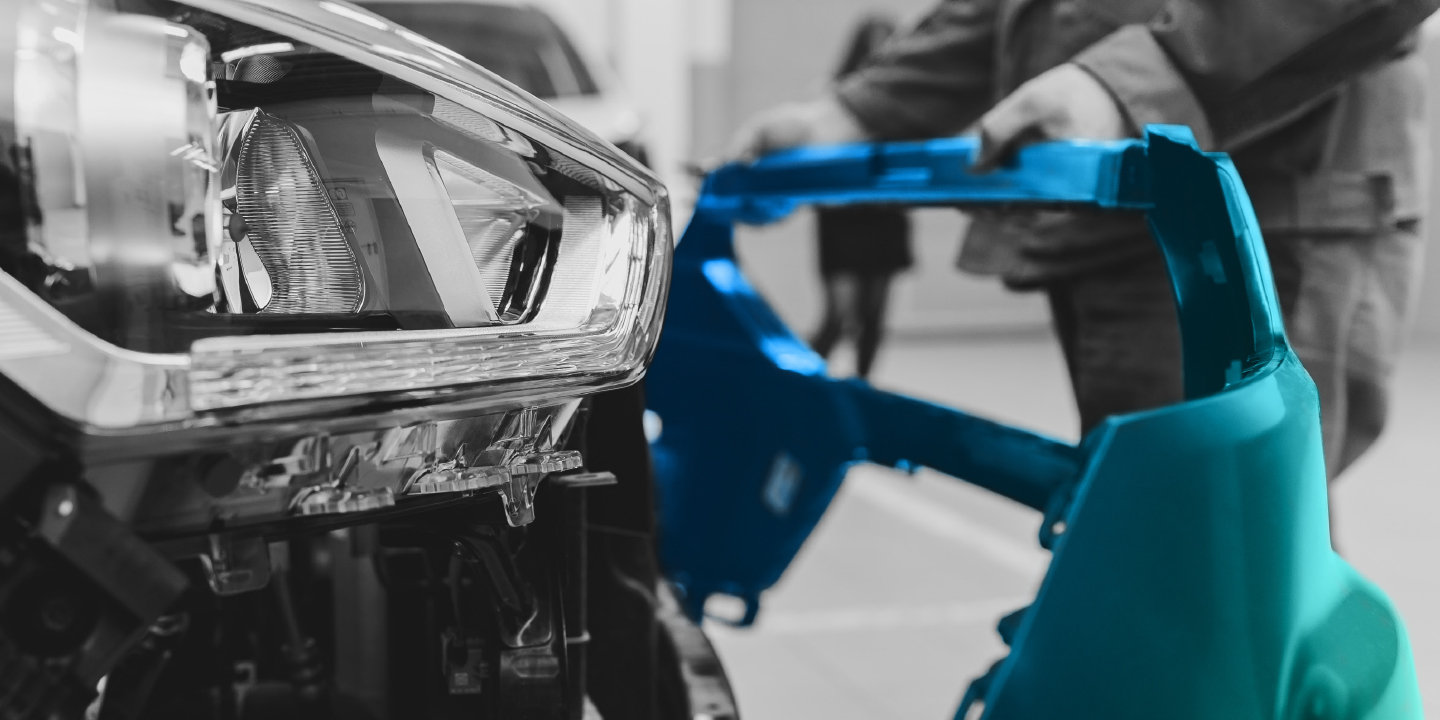
Graph I shows a trend chart measuring Peak Cavity Pressure in the mold, measured at an End of Fill location. This data is a snapshot of normal pressure variation inside the cavity for 49 consecutive shots, and represents the “before” view. Standard Deviation of the Peak Cavity Pressure is 81.37 PSI.
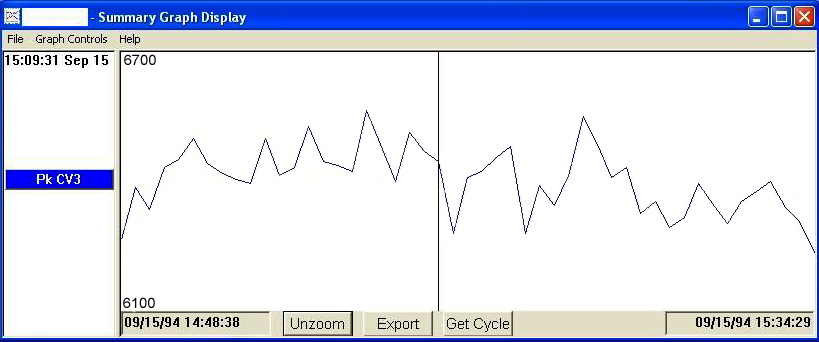
Graph II shows an identical trend chart of the same mold, running in the same machine, with the same material. The process has been changed over to DECOUPLED MOLDING III. Visually, a noticeable reduction can be seen in the amount of normal pressure variation inside the cavity for these 49 consecutive shots. Standard deviation of the Peak Cavity Pressure is now 30.54 PSI.
How does normal pressure variation in the cavity relate to normal process variation? How does normal process variation relate to normal dimensional variation? In this case study, 69% of the measured dimensions on the part were at a Cp>2 with the “before” process. The process running DECOUPLED MOLDING III resulted in 88% of the measured dimensions at a Cp>2. An additional 19% of the measured dimensions were improved to a Cp<2 in the “after” process.
Material Volume Reduced
The packing phase of the process is primarily responsible for creating part dimensions, requiring that a certain amount of material be packed into the cavity. Ideally, a process is set up to run at a certain center point so that the upper and lower dimensional specification limits will not be exceeded; this is taking into account normal process variation.
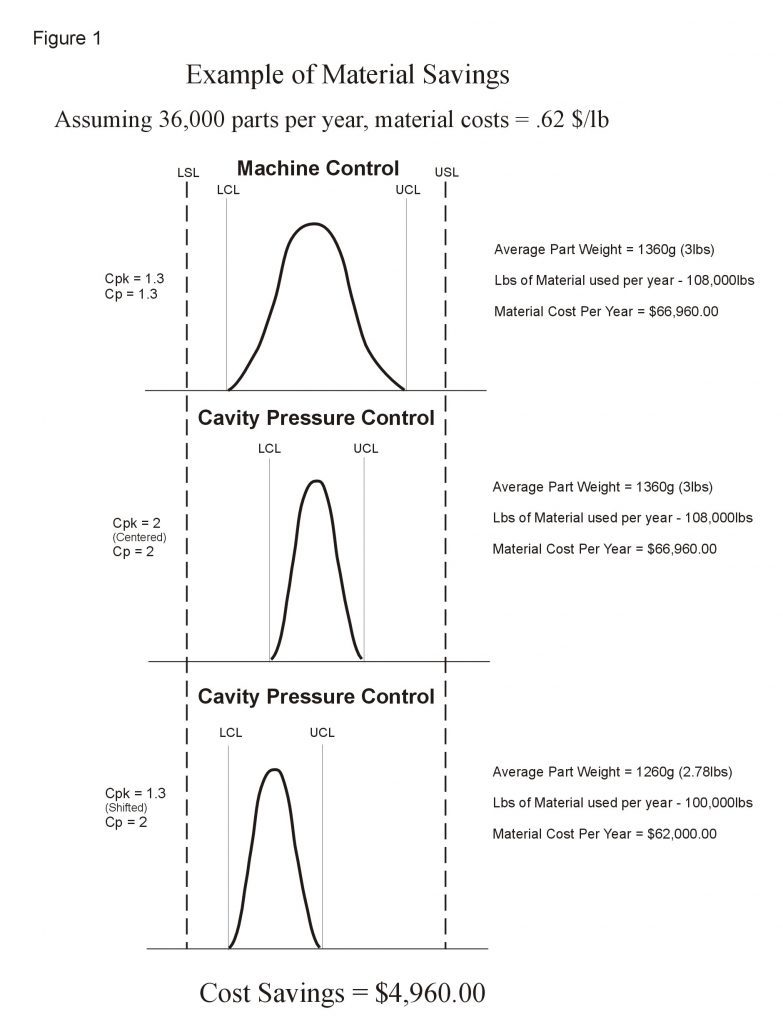
The reduction of overall dimensional variation with Decoupled III Molding affords the processor the opportunity to shift the center of the process. This concept is represented in Figure 1. The “before” process is running at a Cpk of 1.3, while the “after” process runs at a Cpk of 2.0. As a Cpk of 1.3 is an acceptable quality standard, the processor is able to shift the process closer to the Lower Specification Limit, with the result being a reduced material volume of 100 grams per part.
Labor
Labor reduction is not a pleasant subject of discussion. Nonetheless, threats from the global economy force every molder in every country to face it head on. Have you heard China complaining recently about losing work to India?
Return on Investment
Chart 1 is the result of another application of this scenario at an RJG customer site, with data taken from 6 molds running in 4 different machines. Each bar graph represents a mold running “before” and “after” DECOUPLED MOLDING III methods are used.
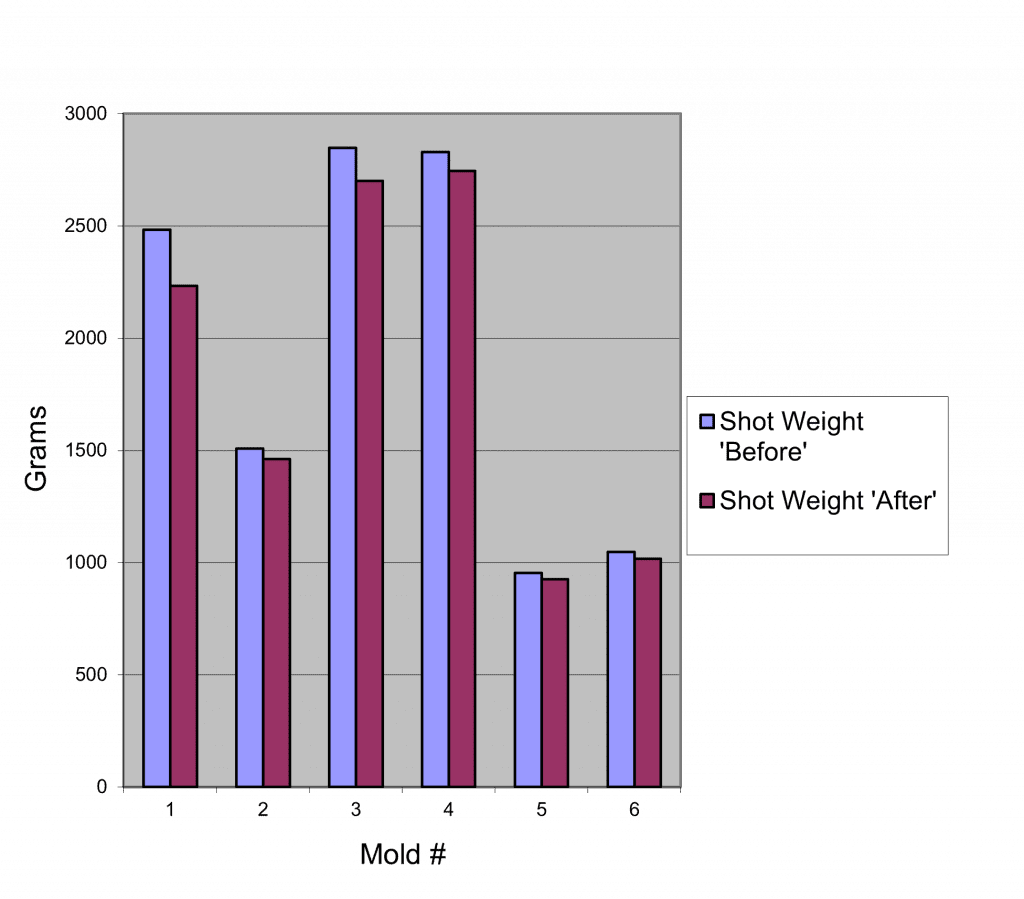
Average Shot Weight – 1945 grams
Average Shot Weight Reduction – 4.5%
Annual Material Savings – $70,933.83
Summary
Molders of large parts are well aware of their part cost structure. If you were able to reduce material volume in parts >1000 grams by 4.5%, what would be the annual savings?
Your local RJG sales rep is equipped with the tools to assist you. With pre-formulated ROI spreadsheets and various options available for getting a system running in your plant to generate the necessary data, we will help you and support you in the evaluation.`