
How to Determine Injection Molding Cooling Time
80%. That is how much of the molding cycle is spent cooling the plastic part. That’s a pretty big chunk of the process, so it’s important to understand what determines how much time should be spent in the cooling phase and what factors influence that cooling time and ultimately, the cycle time.
Let’s review how these four areas impact cooling time:
- Part Design
- Material Selection
- Mold Design
- Processing
Where does the 80% rule come from?
Figure 1 shows an equation to estimate cooling time. If you plug in the appropriate figures, you will see that the cooling time accounts for roughly eighty percent of the entire process.
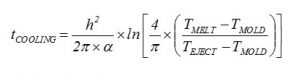
Let’s break down this formula to determine what aspects contribute to cooling time and how.
Part Design
The thicker the part, the longer it needs to cool. That means the Product Design Engineer ultimately determines how long the cycle time will be. In the formula in Figure 1, h2 represents part thickness. Since the thickness is squared, it has the most influence over cooling time.
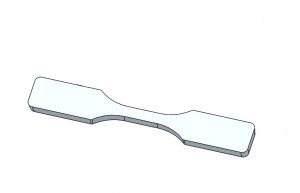
For this analysis, we used an American Society of Testing and Material (ASTM) Tensile Test Bar (Figure 2). The dimensions are an overall length of 63.25mm, a width of 10.41mm, and a thickness of 3.3mm.
Material Selection
Plastic is an insulator. In a melted state, it transfers heat slightly better, but as it gives up heat, its insulation properties increase.
The material properties that are used in the equation are:
- Melt Temperature—Temperature at which material transitions from solid to liquid
- Mold Temperature—Temperature range to best achieve surface finish replication of the cavity surface
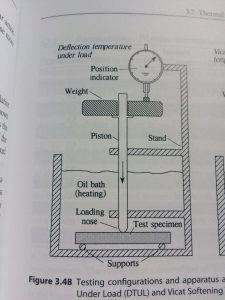
- Heat Deflection/Distortion Temperature (HDT)—Temperature at which a material will deflect under load (Figure 3)
Typically, the eject temperature in the equation uses the HDT, or a temperature slightly below HDT. The ASTM test for HDT closely represents what a part endures during ejection with an ejector pin pushing on a single side, while the opposite side is unsupported.
The alpha symbol in the equation in Figure 1 is an important factor in determining cooling time. It represents Thermal Diffusivity. Figure 4 shows how to find it.
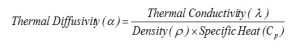
The variables in the Thermal Diffusivity Equation include:
- Thermal Diffusivity—The rate at which a thermal disturbance (a rise in temperature) will be transmitted through a substance
- Density—The quantity of a substance per volume (g/cm3 for plastics)
- Specific Heat—Heat in calories required to raise the temperature of one gram of substance one degree Celsius
For this test, we utilized a Toyolac 100 with a melt temperature range of 446 to 482° F, mold temperature of 104 to 176° F, and HDT of 181° F. Density can typically be found on a Material Data sheet, but for Thermal Conductivity or Specific Heat, it’s best to contact the material supplier directly or utilize the data within the simulation software.
Based on the part geometry and material selection, the estimated cooling time is 18.00 seconds in simulation, shown in Figure 5.
Given all the energy required to melt a material, it’s impractical to remove all of it while the part is still in the mold. Only 40% of the energy must be removed so the part is rigid enough for ejection.
Generally, we do not recommend selecting a cooling timer that only meets the HDT—a buffer should be allowed as a safety factor. A good rule of thumb is adding 20% to the cooling timer to account for variation on incoming material and slight shifts in machine performance. For tighter tolerance parts, the safety factor will likely need to increase.
Mold Design
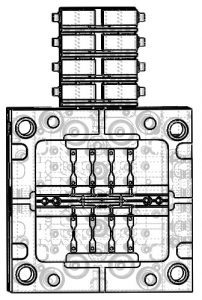
The mold in Figure 6 is an 8-cavity with an “H” pattern runner and a lapped edge gate. Cooling lines have been placed in the cavity, core, and runner block following established guidelines for diameter/depth/pitch. By using proven methods for cooling line design, warp and cooling time are minimized. The mold is also fully instrumented with cavity pressure sensors at post gate and end of fill in conjunction with in-cavity temperature sensors.
Processing
So where does that 80% number come from? Let’s look at the data we collected.
The process segments we looked at were:
- Fill
- Pack/Hold
- Cooling
- Mold Open/Eject/Mold Close
For this experiment, we developed a robust Decoupled II process, resulting in the following process parameters:
- Actual Melt Temperature: 456° F
- Actual Mold Temperature: 121° F with a flow rate of 3.0 gpm per cooling circuit
- Fill Time: 26 seconds with a transfer pressure of 8,356 PSIp
- Pack/Hold Time: 0 seconds at 4,150 PSIp
- Cooling Time: 0 seconds
- Overall Cycle Time: 43 seconds
If we add the process times together and divide by the overall cycle time, we reach a value of 0.85. That means that 85% of the cycle is spent cooling the part so that it can withstand the forces of ejection.
Below, in Graph 1, are the actual part temperatures measured with a surface probe at different time increments during process development. In our experiment, the tensile test bar cooled from 456° F to 203° F in 8.26 seconds (fill and pack/hold time). For the part to get below the HDT of 181° F, it took an additional 8.47 seconds. The temperature only dropped 27.4° F (to 175.6 ° F) in just under 9 seconds, which means that there was a lot of heat transfer efficiency lost.
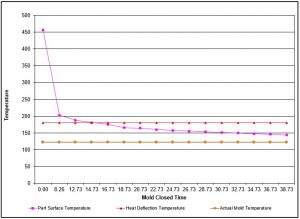
This graph also indicates that at some point, leaving the part in the mold is of little to no added value. Based on geometry, material, mold, and processing, leaving the mold closed for longer than 24.73 seconds really is not cooling the part down much more.
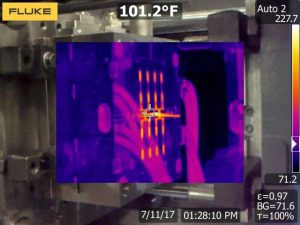
We must consider that using thermal imaging technology or a surface probe are not perfect representations of the actual part. The surface temperature of the part was measured several times over a 2-hour run at 165° F.
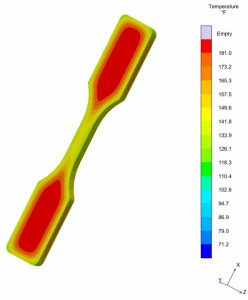
The thermal image below in Figure 6 shows the part to be roughly 188° F, while software predicted 181° F at the same time in the cycle. The image also indicates that the thermal signature across all 8 cavities is nearly identical.
By utilizing 2 different methods, we can feel confident that the part temperature is at about 176° F (5° F under HDT).
Conclusion
Part cooling is always a function of wall thickness and the material that the design engineer selects. It’s up to the mold design engineer to place the cooling channels in the proper location to allow for a minimum cooling time. As a process engineer, the old adage of “fill as fast as possible consistent with quality” still holds true. If the volumetric flow rate is very low, the chances of packing out a part are slim to none because the material will likely be frozen.
For this geometry and material, most of the heat (253° F) is removed during the filling and pack/hold phase. However, to remove the last 27° F to be below the HDT, it takes longer than it did to fill and pack/hold the part. Cooling is a waiting game, but with better engineering (part design, mold design, and process), the time required to cool the material goes down.